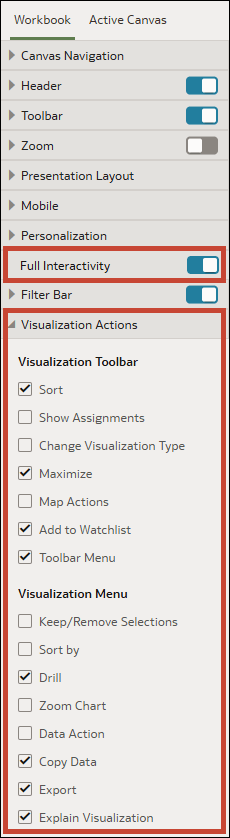
Specify the Workbook Visualization Actions
When you configure the presentation settings for a workbook, you can choose which visualization actions to make available to consumers.
The visualization properties that you set on the Workbook tab are carried over to the Active Canvas tab Visualization Actions properties. You can override the Workbook tab's visualization properties on any individual canvas. See Select Canvas Visualization Toolbar Options.
All Visualization Actions options are grayed out when the Full Interactivity option is set to Off. See Turn On or Off All Workbook and Canvas Actions.
You can choose which of the following options you want consumers to see and use in the visualization toolbar:
- Sort
 : Lets consumers access the Sort Order dialog to sort data in the visualization.
- Show Assignments
 : Lets consumers see which Grammar elements the columns in the visualization are assigned to.
- Change Visualization Type
 : Lets consumers choose a different visualization type.
- Maximize
 : Lets consumers maximize the visualization to the full canvas size.
- Map Actions
 : For map visualizations, lets consumers use the Rectangle, Radial, and Polygon selection options to select data in the map.
- Add to Watchlist
 : Lets consumers add the visualization to a watchlist, if they have the Create and Edit Watchlists permission.
- Toolbar Menu
 : Lets consumers access the visualization menu. The options available to consumers in the menu depend on the selections you make in the Visualization Menu section of Visualization Actions.
- Export
 : Lets consumers export the visualization.
If you enable Toolbar Menu , you can choose which of the following options you want consumers to access in the visualization menu:
, you can choose which of the following options you want consumers to access in the visualization menu:
- Keep/Remove Selections - Lets consumers use the Keep Selected and Remove Selected options for data points in the visualization.
- Sort By: Lets consumers select a sorting method for the attributes or measures in the visualization.
- Drill: Lets consumers access the Drill to Attribute/Hierarchy option for data points in the visualization.
- Zoom Chart: Lets consumers increase the size of the data points on the chart by a predefined amount.
- Data Action: Lets consumers access any data actions available to them for data points in the visualization.
- Copy Data: Lets consumers copy the visualization's data to their clipboard.
- Export: Lets consumers export the visualization.
- Explain Visualization - Lets consumers access Contextual Insights for the visualization, if available.
- On your home page, hover over a workbook, click Actions, and select Open.
- From the Preview menu
 , select Configure Presentation.
 - In the presentation settings panel, click the Workbook tab.
- In the Visualization Actions section, deselect the actions that you don't want consumers to perform, or select the actions that you want consumers to perform.
- Click Save.