About Tables and Pivots
In Oracle Analytics, you can create table and pivot visualizations to display your data in an organized grid format. You can use them to summarize your data or show it in detail.
A table displays data in rows and columns in a tabular format. A pivot is similar to a table but summarizes and aggregates groups of data values in columns and rows. You can swap the columns and rows in pivots to easily see different summaries of the same data.
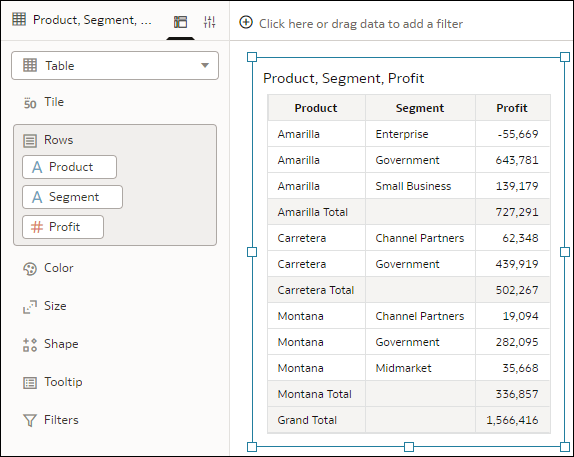
For example, you might use a table to show the profit for each product based on customer segment.
Description of the illustration table_example.png
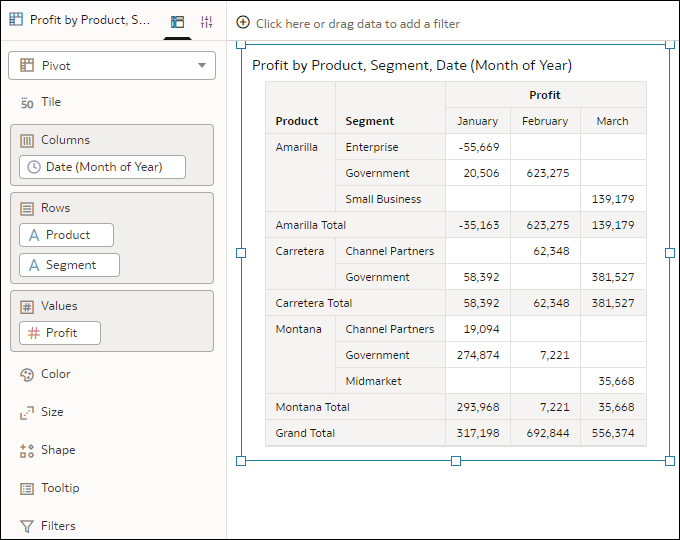
You might use a pivot to show the same data and add a time column to break the profit down by month. The pivot provides a clearer summary of each data element with aggregated totals.
Description of the illustration pivot_example.png
To swap the columns and rows in a pivot, you can drag the data elements to different drop targets in the Grammar pane, or you can click and drag the handle for a column or row in the visualization to another area of the visualization.
- Configure the font for different cells such as headers, data, and totals
- Configure the header names and totals labels
- Turn available data actions on or off for consumers
- Show or hide grand totals and subtotals
- Configure the number format for measure values
Sorting Data in Tables
If a table visualization includes subtotals or contains a dimension, then all column sorts on columns after the subtotal or dimension, are sorted in the subtotal group.
If you’re working with a table view with multiple sorts, then the system always sorts the last column that you sorted first. In some cases where specific values display in the left column, you can’t sort the center column. For example, if the left column is Product and the center column is Product Type, then you can’t sort the Product Type column. To work around this issue, swap the positions of the columns and try to sort again.