Use Auto Insights to Get Immediate Insights into Your Data
When you upload a dataset to Oracle Analytics, Auto Insights compute interesting insights on the data.
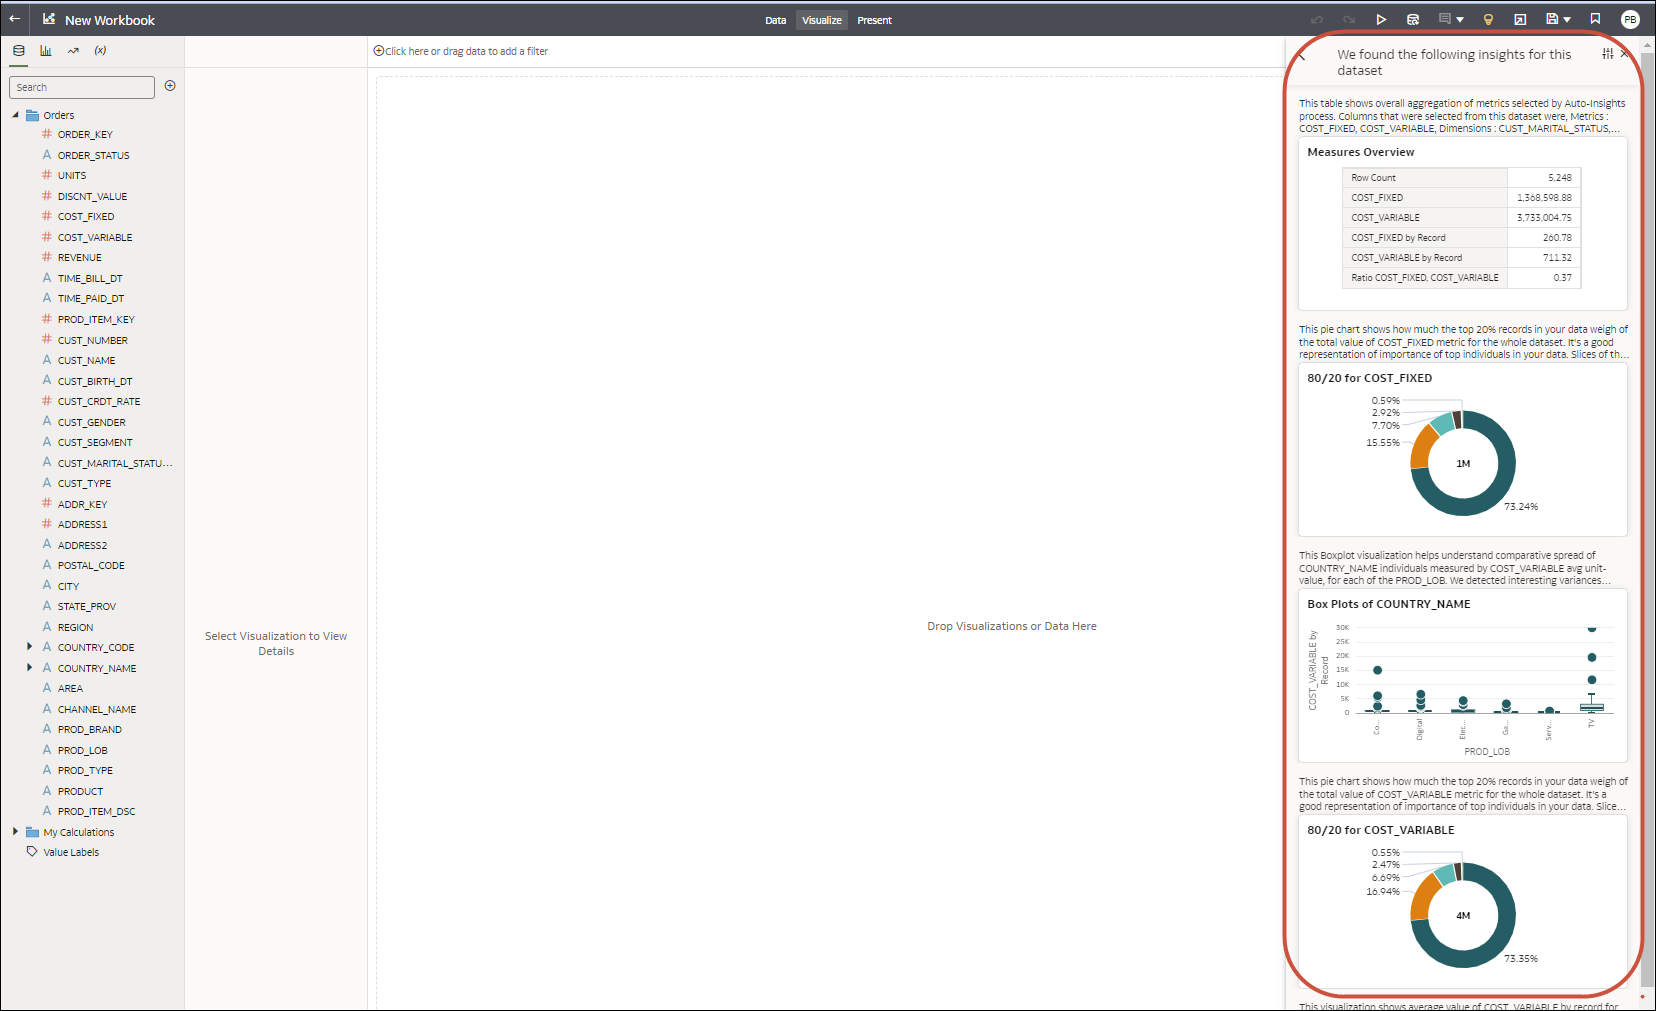
Click AI Assistant ![]() in the top right corner of the Visualize page (when insights are ready, the icon turns yellow
in the top right corner of the Visualize page (when insights are ready, the icon turns yellow![]() ) and scroll through the pane for a list of ranked insights. The artificial intelligence engine that generates these insights is focused on finding the columns with the most appropriate data for interesting insights, and on how to apply advanced analytics techniques to those columns.
) and scroll through the pane for a list of ranked insights. The artificial intelligence engine that generates these insights is focused on finding the columns with the most appropriate data for interesting insights, and on how to apply advanced analytics techniques to those columns. 
Description of the illustration insights.png
- Which types of columns are present in your dataset (for example, how many dimensions, how many dates, how many metrics)
- Which data is present in each of the columns (for example, what are the cardinalities of dimensions, their sparsity, distribution)
As you scroll down the insights, visualizations are rendered with an overall text description to help you understand what the insight is about, how to read it, and why it qualifies to display here. Typically, insights that show a high contrast in values (for example, crossing line trends, high variations in bars, spread in scatter plots) will rank higher in the pane. You can drag any of these insights onto your workbook canvas or click the Add to canvas icon + on any visualization, or by double-clicking the visualization itself.
Once the visualizations you selected are on the canvas, they behave exactly as if you manually designed them from scratch. Any viewer can fully interact with any of these visualizations (for example, keep selected, use as filters), or even customize them further by replacing formats and columns or editing calculations. Any custom calculations required to support the insights you dragged onto your canvas are automatically added under the My Calculations folder. You can review these calculations to understand their formulas and modify them further.