Use Explain to Identify the Drivers of Your Selected Column
In Oracle Analytics, right-click a target column in your dataset, select Explain, then select the Key Drivers tab.
If You're Explaining a Measure Column
The Explain results depend on the aggregation rule of the selected column. If the measure has an additive aggregation rule (for example, sum), the Key Drivers tab isn't displayed. In order to see the Key Drivers tab you first need to set the aggregation rule to Average for your measure. This can be done in Oracle Analytics data preparation. When your measure has an aggregation rule of Average, the Key Drivers tab is displayed by Explain. The Key Drivers tab displays attribute columns that have the highest correlation with the value of your target measure. In other words, it indicates which columns in the dataset are the most significant drivers for the value of that measure.
Description of the illustration explain-key-drivers.png
If You're Explaining an Attribute Column
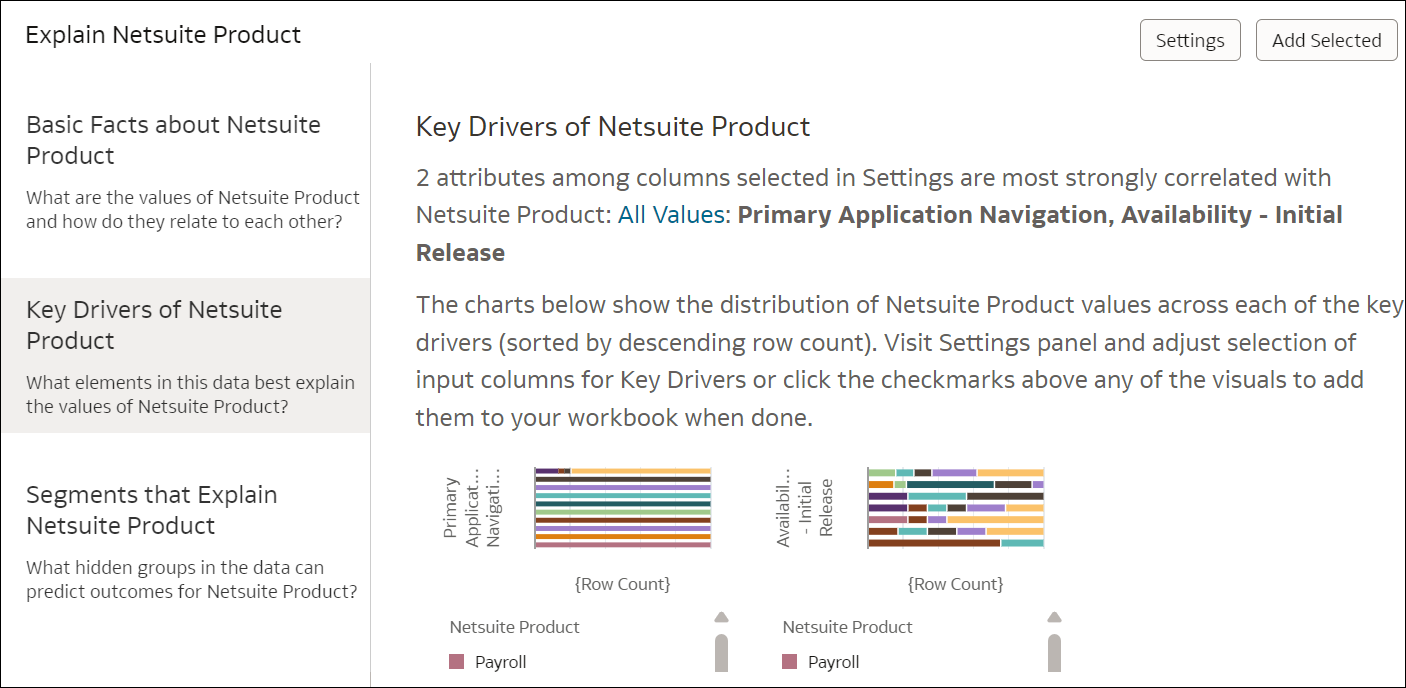
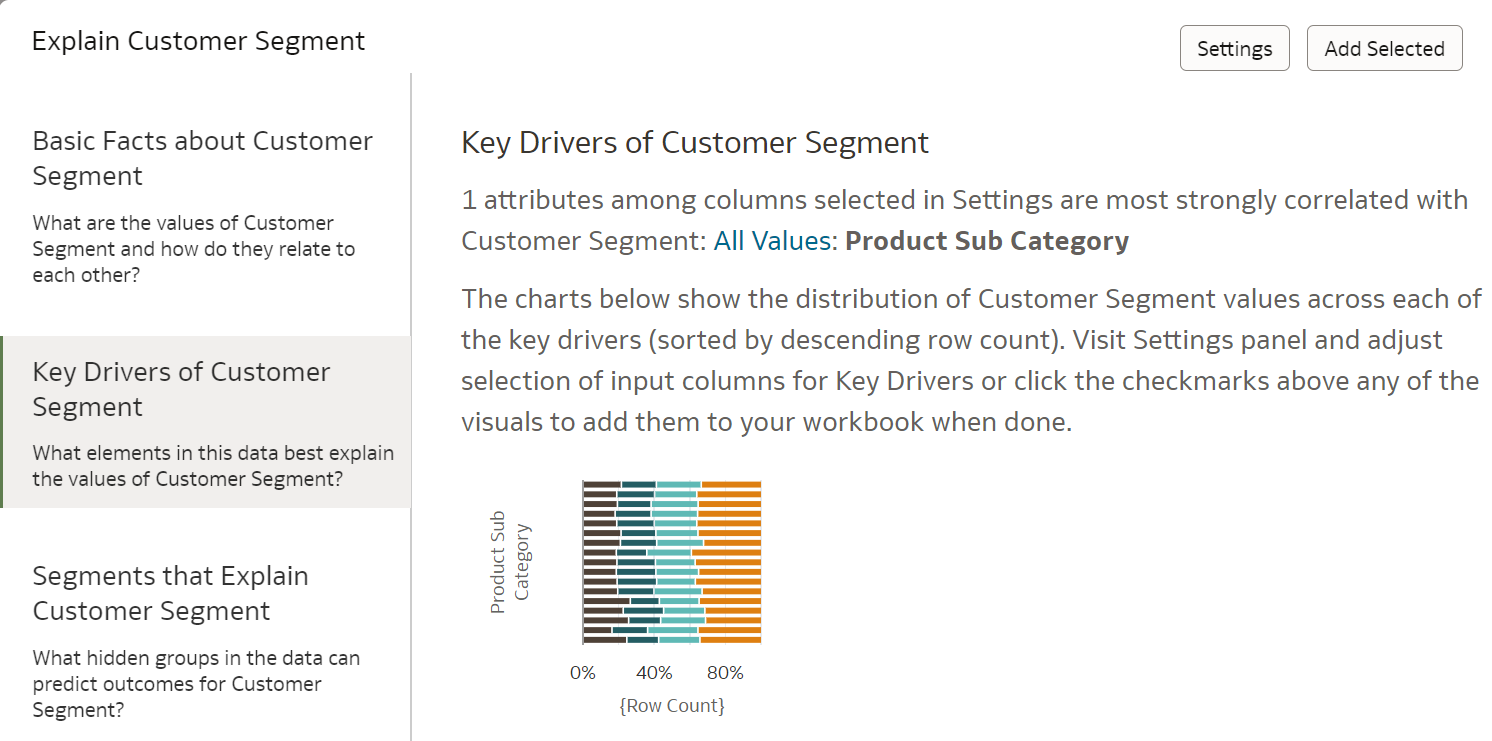
Once the Explain window opens, click the Key Drivers tab (left of the window). This tab displays visualizations indicating the various columns that are the most significant in driving values from the attribute you targeted, meaning columns from your dataset that have the highest correlation with the value of your target attribute. A paragraph at the top lists these key driver columns. You can also reduce the scope of the key drivers by selecting only a specific value of your attribute column (drop down in the paragraph). If you leave All Values selected by default, then the visualizations indicate key drivers for all values of your target attribute.
Description of the illustration key-drivers-attributes.png