Use a Parameter as a Visualization's Axis Label

A parameter value can be dynamically passed to a visualization's axis labels. The current value of the parameter is used as the axis label's name.

For example, you can create a parameter called Year and add it to a dashboard filter on the canvas. Then you can reference the parameter in a visualization's value axis so that when the user chooses a year value, the value axis title is updated to include the selected year.
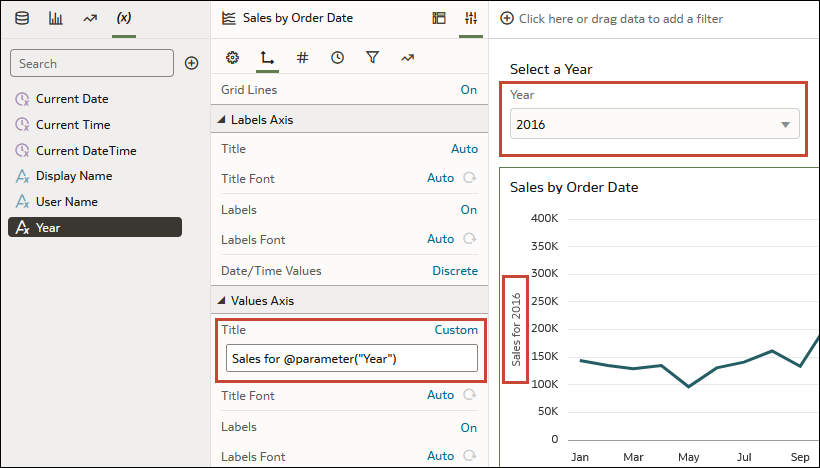
Parameter in axis label

  1. On the Home page, hover over a workbook, click Actions (Actions menu ellipsis icon), then select Open.
  2. On the canvas, select a visualization and click Properties to display the Properties panel and click Axis to display the axis properties.
  3. Locate the axis label where you want to use the parameter. Go to the Title property, click Auto, and then click Custom.
  4. Clear or modify the default title and use this syntax to include a parameter in the:
    @parameter("<parameter name>")
    For example:
    @parameter("Year")
  5. Click Save to save the workbook.