6 Monitor APEX Service Performance

Monitor APEX Service performance by viewing metrics.

Topics:

View Metrics for APEX Service

Monitor the performance of your APEX Service by viewing metrics on the APEX Instance Details page.

Note:

To view metrics you must have the required access as specified in an Oracle Cloud Infrastructure policy (whether you're using the Console, the REST API, or another tool). See Securing Monitoring in Oracle Cloud Infrastructure Documentation.

To view APEX metrics:

  1. Navigate to the OCI Console Sign-In Page and sign in as described in Access Oracle Cloud Infrastructure.
  2. Next to the Oracle Cloud logo, click the Navigation menu (Navigation menu).
  3. From the Oracle Cloud Infrastructure left navigation list, select Developer Services and then APEX Application Development or APEX Instances.
  4. Under Filters, narrow the display by selecting APEX from the Type list.
  5. Find your APEX Service instance and click the three dots Row menu (or Row menu) and select View details.
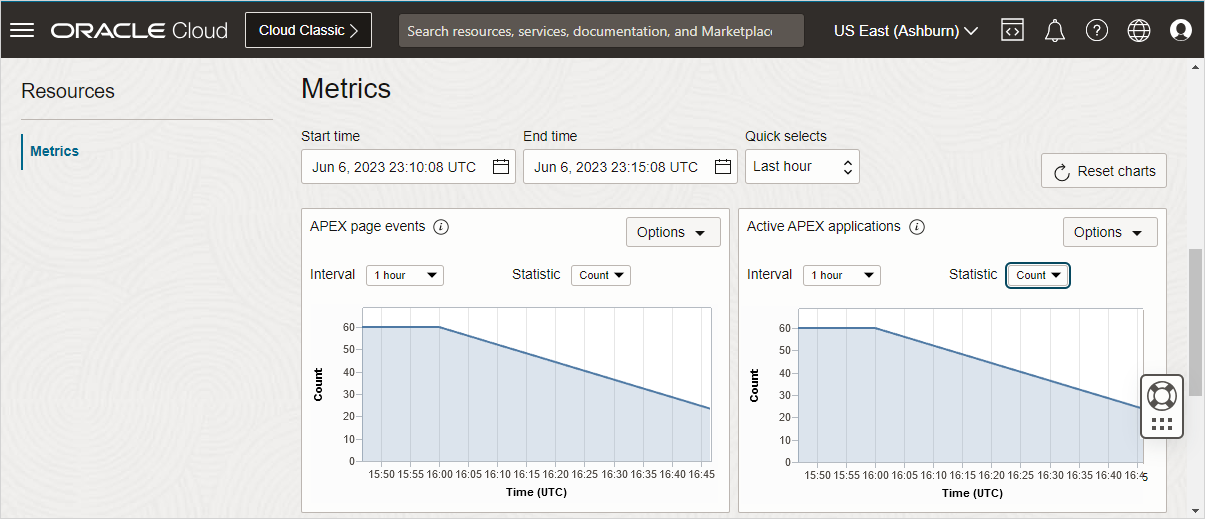
  6. On the APEX Instance Details page, scroll down to Metrics.

    The following table describes the Metrics on the APEX Instance Details page.

    Note:

    Metrics that are marked with an asterisk (*) require Application Activity Logging be enabled in APEX Administration Services and at the application level. See the Logging attribute in Properties in Oracle APEX App Builder User’s Guide and Enabling Application Activity Logging in Oracle APEX Administration Guide.
    Metric Metric Display Name Unit Description Collection Interval

    APEXPageEvents*

    APEX page events

    Count

    Displays the number of page events over time.

    Statistic: Sum

    Interval = 1 minute

    5 minutes

    APEXApps*

    Active APEX applications

    Count

    Displays the number of active APEX applications over the time interval.

    Statistic: Sum

    Interval: 1 hour

    5 minutes

    APEXPageLoadTime*

    APEX page load time

    Seconds

    Average APEX page execution time over the time interval.

    Statistic: Mean

    Interval = 1 minute

    5 minutes

    APEXWorkspaceCount APEX workspaces

    Count

    Displays the number of APEX workspaces over the time interval.

    Statistic = Sum

    Interval = 1 minute

    5 minutes

  7. Control the time interval by configuring the Start time, End time, or Quick Selects.
  8. For each chart, select the Interval and Statistic, or use the default values.
  9. For each metric, click Options to access the following:
    • View query in Metrics Explorer
    • Copy chart URL
    • Copy query (MQL)
    • Create an alarm on this query
    • Table view

See Also:

View Metrics for an Autonomous Database Instance

View metrics for an APEX Service Autonomous Database instance.

Note:

To view metrics you must have the required access as specified in an Oracle Cloud Infrastructure policy (whether you're using the Console, the REST API, or another tool). See Securing Monitoring in Oracle Cloud Infrastructure Documentation.

To view metrics for an APEX Service Autonomous Database.

  1. Navigate to the OCI Console Sign-In Page and sign in as described in Access Oracle Cloud Infrastructure.
  2. Next to the Oracle Cloud logo, click the Navigation menu (Navigation menu).
  3. From the Oracle Cloud Infrastructure left navigation list, select Developer Services and then APEX Application Development or APEX Instances.
  4. Under Filters, narrow the display by selecting APEX from the Type list.
  5. Find your APEX Service instance and click the three dots Row menu (or Row menu) and select View Details.

    The APEX Instance Details page appears.

  6. In APEX instance information, click the Database name.
  7. On the Autonomous Database details page, scroll down to Metrics.
    A chart displays for each metric.
  8. Control the time interval by configuring Start time, End time, or Quick Selects.
  9. For each chart, select the Interval and Statistic, or use the default values.

    Tip:

    To learn about the available database-centric metrics, see Available Metrics: oci_autonomous_database in Using Oracle Autonomous Database Serverless.
  10. Optionally, to view all the Autonomous Database metrics:
    1. In the Metrics area, click View all database metrics.
    2. From Metric namespace, select oci_autonomous_database.
    3. Next to Dimensions, click Edit.
    4. In the Edit dimensions dialog, for deploymentType select Shared.
    5. Click Done.
  11. To create an alarm on a metric, click Options and select Create an Alarm on this Query.

See Also:

View Autonomous Database Logs and Audit Trails

View Autonomous Database logs and audit trails.

Note:

To view logs and audit trails you must have the required access as specified in an Oracle Cloud Infrastructure policy (whether you're using the Console, the REST API, or another tool). See Getting Started with Policies for information on policies.

To view audit trails and logs for an Autonomous Database instance:

  1. Navigate to the OCI Console Sign-In Page and sign in as described in Access Oracle Cloud Infrastructure.
  2. Next to the Oracle Cloud logo, click the Navigation menu (Navigation menu).
  3. From the Oracle Cloud Infrastructure left navigation list, select Developer Services and then APEX Application Development or APEX Instances.
  4. Under List Scope, narrow the display. From the Type list, select APEX.
  5. Find your APEX Service instance and click the three dots Row menu (or Row menu) and select View Details.

    The APEX Instance Details page appears.

  6. In APEX Instance Information, click the Database name.
  7. On the Autonomous Database details page, scroll down to Metrics and click View audit and logs.
  8. Under Logging,
    • Click Logs to view log information.
    • Click Audit to view audit information.

See Also:

View Autonomous Database Metrics in a Compartment

View Autonomous Database metrics in a compartment.

Note:

To view metrics you must have the required access as specified in an Oracle Cloud Infrastructure policy (whether you're using the Console, the REST API, or another tool). See Getting Started with Policies.

To view Autonomous Database metrics in a compartment:

  1. Navigate to the OCI Console Sign-In Page and sign in as described in Access Oracle Cloud Infrastructure.
  2. Next to the Oracle Cloud logo, click the Navigation menu (Navigation menu).
  3. From the Oracle Cloud Infrastructure left navigation list, select Developer Services and then APEX Application Development or APEX Instances.
  4. Under Filters, narrow the display by selecting APEX from the Type list.
  5. Find your APEX Service instance and click the three dots Row menu (or Row menu) and select View Details.
    The APEX Instance Details page appears.
  6. In APEX Instance Information, click the Database name.
    Autonomous Database details page appears.
  7. Scroll down to Metrics and click View all database metrics.
  8. On the Service Metrics page:
    1. Compartment - Select your compartment.
    2. Metric namespace - Select oci_autonomous_database.
  9. If you want to limit the metrics you see, next to Dimensions click Add (or click Edit if you have already added dimensions).
    1. Dimension Name field - Select a dimension.
    2. In the Dimension Value field - Select a value.
    3. Click Done.
  10. To create an alarm on a metric, click Options and select Create an Alarm on this Query.

See Also:

Overview of Monitoring and Managing Alarms in Oracle Cloud Infrastructure Documentation

Autonomous Database Metrics and Dimensions

You can limit the database instances where you see metrics with dimensions. The available dimensions include: workload type, instance display name, region, and the instance OCID.

Use dimensions by selecting values in the Oracle Cloud Infrastructure Console Service Metrics page or by setting dimension values with the API.

See Also: