Analytics Charts Available on the Errors and Rejections Page
View rejection and error metrics about requests sent to or from APIs, gateways, or applications on theErrors and Rejections page. Available charts and options vary based on the rights you have.
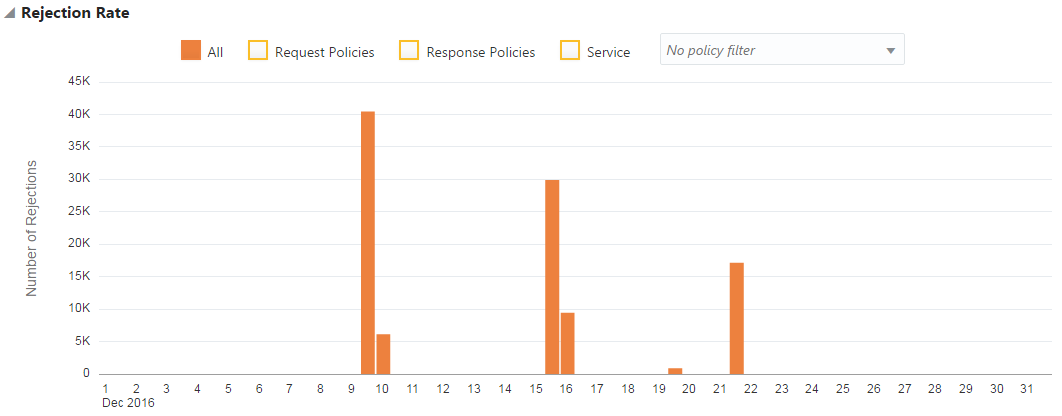
Rejection Rate Chart
The Rejection Rate chart displays the number of rejected requests sent to an APIsent to all APIs deployed to a gateway.
To view Rejection Rate chart data:
-
Select All to view all rejections for the period.
-
Select Request Policies to view requests that were rejected by request policies for the period.
-
Select Response Policies to view responses that were rejected by response policies for the period.
-
Select Service to view requests that were rejected by the backend service.
-
Select an option in the no policy filter list to view data for a specific policy type.

Description of the illustration rejection-rate.png
To view summary information for a specific period, hover your mouse over a vertical bar in the Rejection Rate chart.
By default, data for the current day is displayed. To display data for a different period, see Working with Analytics Time ControlsHow Do I View Analytics for a Specific Time Period?.
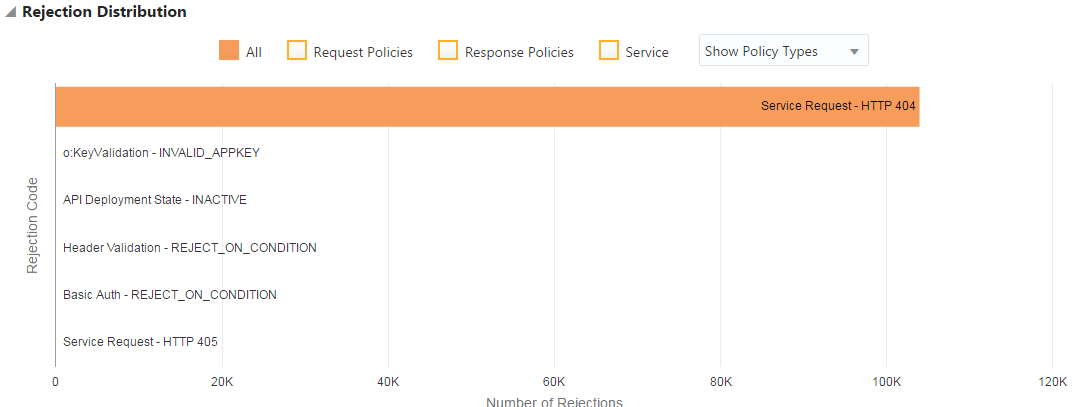
Rejection Distribution Chart
The Rejection Distribution chart displays the number of rejections by specific policies or services.
To view Rejection Distribution chart data:
-
Select All to view all rejections per policy or service.
-
Select Request Policies to view the number of rejections per request policy.
-
Select Response Policies to view the number of rejections per response policy.
-
Select Service to view the number of rejections per service.
-
Select Show Policy Types to view rejections for each policy type. For example, if you have multiple header validation policies, selecting Show Policy Types displays all header validation policy rejections as a single data point.
-
Select Show Policy Instances to view rejections for each instance of a policy. For example, if you have multiple header validation policies, selecting Show Policy Instances displays rejections from each of the header validation policies as separate data points.

Description of the illustration rejection-distribution.png
To view summary information for a specific policy, hover your mouse over a horizontal bar in the Rejection Distribution chart.
By default, data for the current day is displayed. To display data for a different period, see Working with Analytics Time ControlsHow Do I View Analytics for a Specific Time Period?.
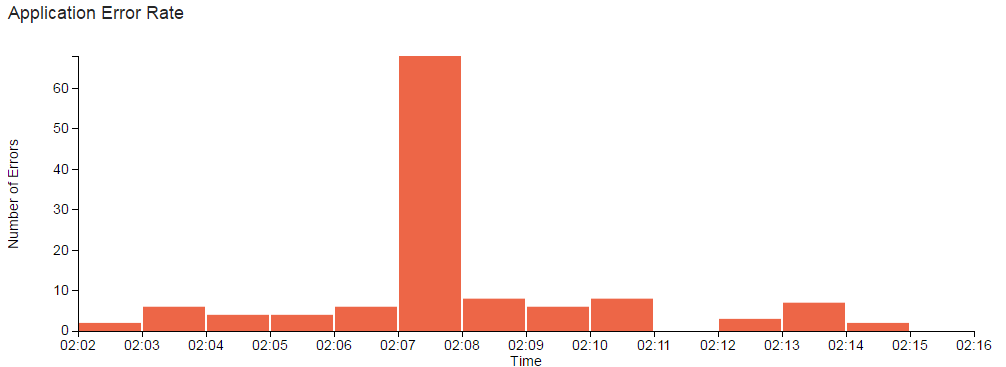
Application Error Rate Chart
The Error Rate chart displays the number of errors as a percentage of all errors for the defined period.The Application Error rate chart displays the number of errors produced by requests from an application.
To view Error Rate chart data:
-
Select All to view all errors for the period.
-
Select Request Policies to view errors caused by request policies for the period.
-
Select Response Policies to view errors caused by response policies for the period.
-
Select Service to view errors caused by requests rejected by the backend service.
-
Select Show Policy Types to view errors for each policy type.
-
Select Show Policy Instances to view errors for each instance of a policy.

Description of the illustration app-error-rate-dp.png
To view summary information for a specific period, hover your mouse over a vertical bar in the Application Error Rate chart.
By default, data for the current day is displayed. To display data for a different period, see Working with Analytics Time ControlsHow Do I View Analytics for a Specific Time Period?.
By default, data for the last 24 hours is displayed. To display data for a different period, see Working with Analytics Time ControlsHow Do I View Analytics for a Specific Time Period?.
Application Error Distribution Chart
The Application Error Distribution chart displays the number of API request errors for specific policiesoccurrences of each error as a percentage of all errors for the defined period..
To view Application Error Distribution chart data:
-
Select All to view all errors.
-
Select Request Policies to view errors caused by request policies.
-
Select Response Policies to view errors caused by response policies.
-
Select Service to view errors caused by the backend service.
-
Select Show Policy Types to view errors for each policy type. For example, if you have multiple header validation policies, selecting Show Policy Types displays all header validation policy rejections as a single data point.
-
Select Show Policy Instances to view errors for each instance of a policy. For example, if you have multiple header validation policies, selecting Show Policy Instances displays rejections from each of the header validation policies as separate data points.

Description of the illustration app-error-distribution-dp.png
To view summary information for a specific policy, hover your mouse over an entry in the Error Distribution chart.