Analytics Charts Available on the General PageWhich Analytics Charts Are Available on the General Page?
View the request volume, response time, and other metrics about requests sent tofrom your APIsgatewaysapplications on the General page.
Request Volume Chart
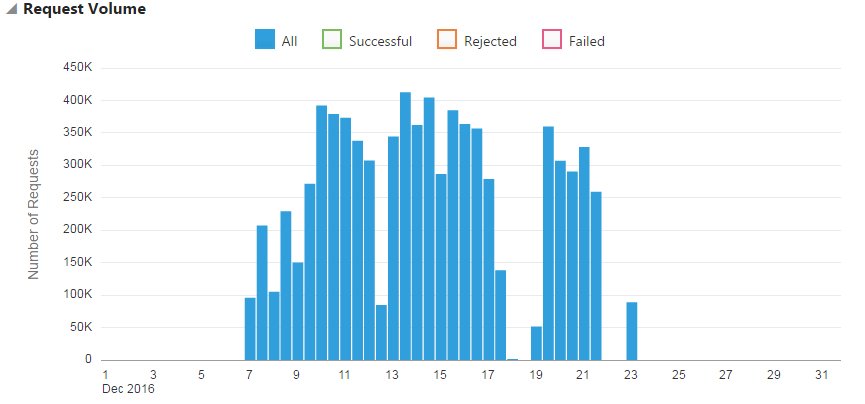
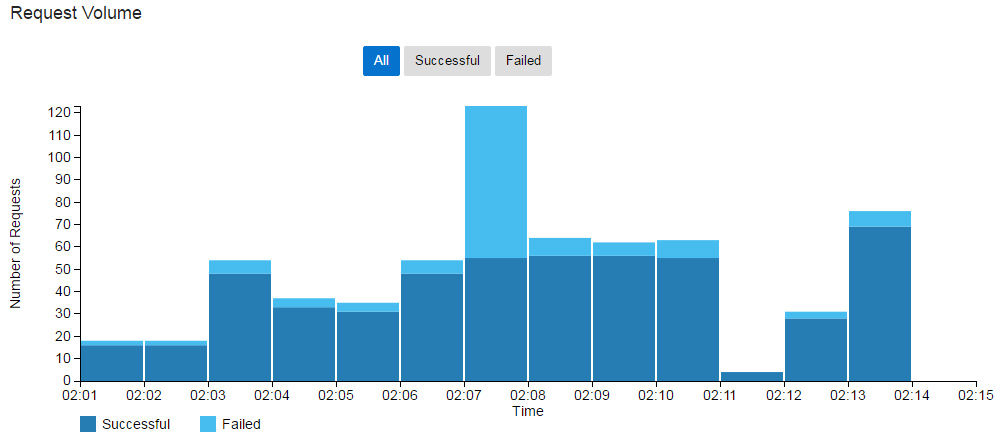
Use the Request Volume chart to view request traffic volume, request trends, and request success or failure rates.
The Request Volume chart displays the number of requests sent to an APIsent to all APIs deployed to a gatewaysent by an application.
To view Request Volume chart data:
-
Select All to display all requests.
-
Select Successful to display successful requests.
-
Select Rejected to display rejected requests.
-
Select Errored to display requests that generated errors.
-
Select Failed to display requests that failed.

Description of the illustration request-volume-chart-mp.png

Description of the illustration request-volume-chart-dp.png
To view summary information for a specific period, hover your mouse over a vertical bar in the Request Volume chart.
By default, data for the current day is displayed. To display data for a different period, see Working with Analytics Time ControlsHow Do I View Analytics for a Specific Time Period?.
By default, data for the last 24 hours is displayed. To display data for a different period, see Working with Analytics Time ControlsHow Do I View Analytics for a Specific Time Period?.
Response Time Chart
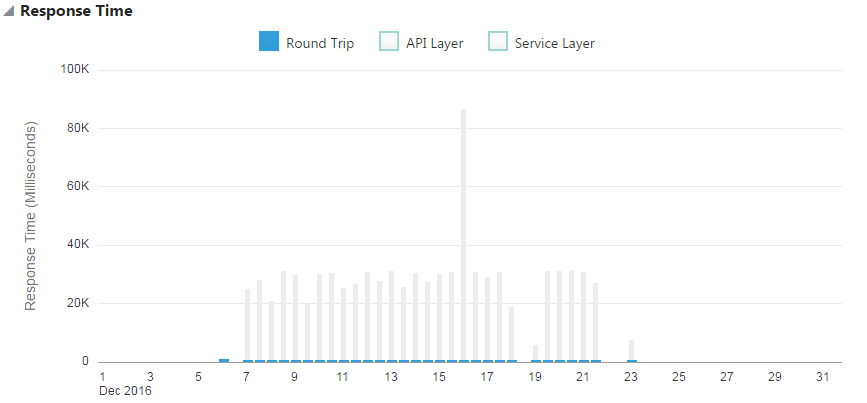
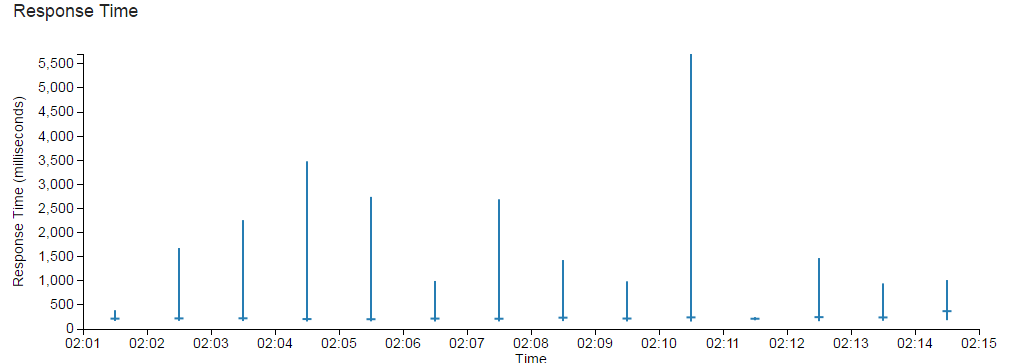
Use the Response Time chart to view the response times for requests, response time trends, and the time requests spend in the API and service layers.
The Response Time chart displays round-trip request and response times (in milliseconds) for the selected APIgatewayapplication. The shortest and longest response times for the period are represented by vertical bars. A horizontal bar indicates the median round-trip time for the period.
To view Response Time chart data:
-
Select Round Trip to display the median round-trip request and response times for the period.
-
Select API Layer to display the time round-trip time request and response times were active in the API layer.
-
Select Service Layer to display the time round-trip time request and response times were active in the service layer.

Description of the illustration response-time-chart-mp.png

Description of the illustration response-time-chart-dp.png
To view summary information for a specific period, hover your mouse over a vertical or horizontal bar in the Response Time chart.
By default, data for the current day is displayed. To display data for a different period, see Working with Analytics Time ControlsHow Do I View Analytics for a Specific Time Period?.
By default, data for the last 24 hours is displayed. To display data for a different period, see Working with Analytics Time ControlsHow Do I View Analytics for a Specific Time Period?.
Payload Size Chart
To view Payload Size chart data:
-
Select Request to view request payload sizes for the period.
-
Select Response to view response payload sizes for the period.

Description of the illustration payload-size-chart.png
To view summary information for a specific period, hover your mouse over a vertical bar in the Payload Size chart.
By default, data for the current day is displayed. To display data for a different period, see Working with Analytics Time ControlsHow Do I View Analytics for a Specific Time Period?.
Requests by API Chart
The Requests by API chart displays requests, rejections, and errors for each API deployed to the gateway.
The Requests by API chart displays this data:
-
The volume of requests sent to each API.
-
The percentage of requests sent to each API.
-
The volume of rejected requests for each API.
-
The percentage of rejected requests for each API.
-
The error volume for each API.
-
The error percentage for each API.
Requests by Resource Chart
The Requests by Resource chart displays the volume and distribution of requests (as a percentage) to resources for an API.
The Requests by Resource chart displays this data:
-
The volume of requests sent to each resource.
-
The percentage of requests sent to each resource.
-
The volume of rejected requests for each resource.
-
The percentage of rejected requests for each resource.
-
The volume of errors processed by each resource.
-
The percentage of errors processed by each resource.

Description of the illustration requests-resource.png