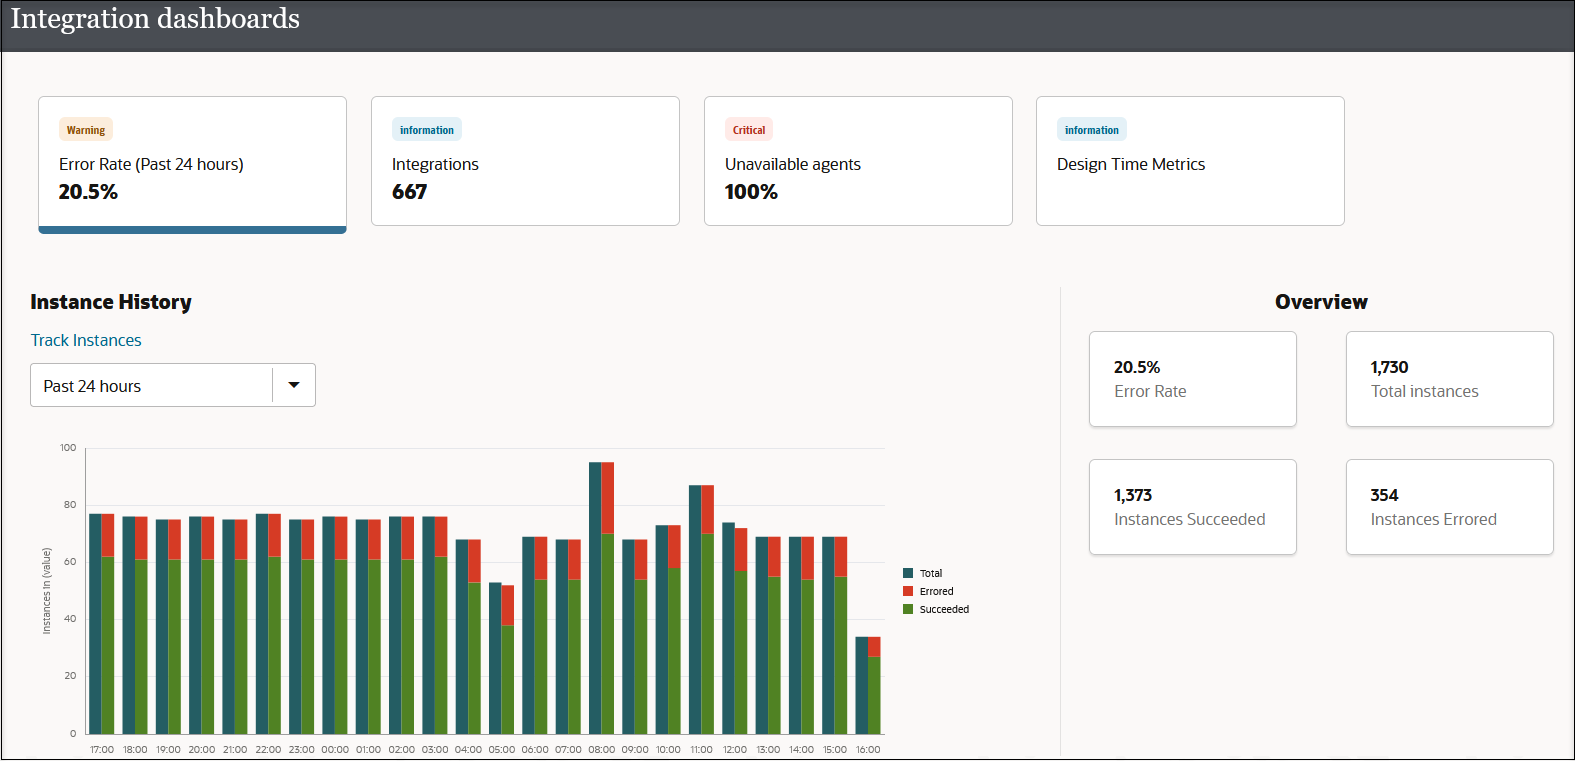
About the Observability Pages
Oracle Integration includes several sets of pages for monitoring integrations and their components, including the Observability pages, which you open from the navigation pane, and the Observe page within a project.
About the Observability Pages
The Observability pages, which you open from the navigation pane, provide information about all the components in your instance, including integrations that are and aren't in projects.
| Page | Description | What you can do on the page |
|---|---|---|
|
Dashboards |
When you want to check the overall health of everything your organization has built, head to the interactive Dashboards page, which provides at-a-glance information about the messages that Oracle Integration processed and the integrations that ran. |
See View the Dashboard. |
|
Design time audit |
Who updated an integration or other component, and when did the update happen? Get this information on the Design time audit page. |
See Check the Design Time Audit History for an Integration or Other Component. |
|
Integrations |
The Integrations page is where to go when you want to see high-level information about your integrations and their messages. |
|
|
Subscriptions |
If you have integrations that use the Event pattern, open the Subscriptions page to get status information about these integrations. |
|
|
Agents |
When the Dashboards page tells you that one or more connectivity agents is unavailable, open the Agents page to identify the agent that is down. |
See Monitor Agents. |
|
Instances |
When an integration runs, Oracle Integration creates an integration instance for it. Track the status of all your integration instances and view their message payloads on the Instances page. |
|
|
Errors |
Like the Instances page, the Errors page lists integration instances. However, while the Instances page lists all integration instances, the Errors page lists only the integration instances that failed. |
Many tasks from the Instances page, plus:
See Manage Errors. |
|
Future runs |
On the Future runs page, view all the schedule integrations and the times they're scheduled to run. This page helps you understand the timeline of your integrations and the queue so that you don't schedule too many integrations to run at the same time. |
|
|
B2B tracking |
If you use B2B for Oracle Integration, use the B2B tracking page to track information related to your B2B integrations. |
See Track B2B Messages in Using B2B for Oracle Integration 3. |
|
Fusion Applications |
When an integration that consumes a published event from an Oracle Fusion Application fails, troubleshooting the failure can be difficult. In such cases, head to the Fusion Applications page, where you can determine the source of the error. |
This page is only for integrations that use the Oracle ERP Cloud Adapter or the Oracle CX Sales and B2B Service Adapter (previously known as the Oracle Engagement Cloud Adapter).
See Diagnose and Manage Event-Based Oracle Fusion Applications Integrations. |
About the Observe Page in a Project
On the Observe page in a project, you can monitor the automation solutions in the project. Many tabs are identical to their counterpart pages in the Observability area, with one key difference: The Observe pages show information only for the automation solutions that are in the project.
