Inspect the Compute Environment
You can inspect the state of your internal compute environment to see if it is attached to Graph Studio.
Additionally, you can also view the memory configuration for the graph server and
the supported notebook interpreters.
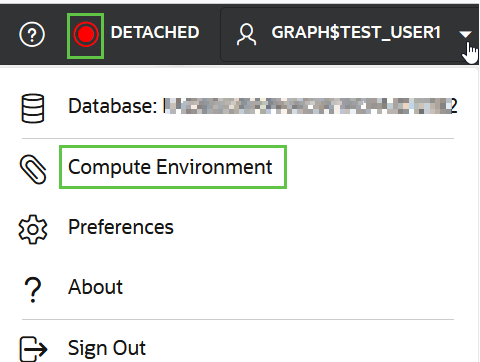
- Click on your username on the top right drop-down menu of your interface.
- Select Compute Environment from the drop-down menu.
Tip:
You can click the compute environment status indicator in the header to directly open the Compute Environment slider.
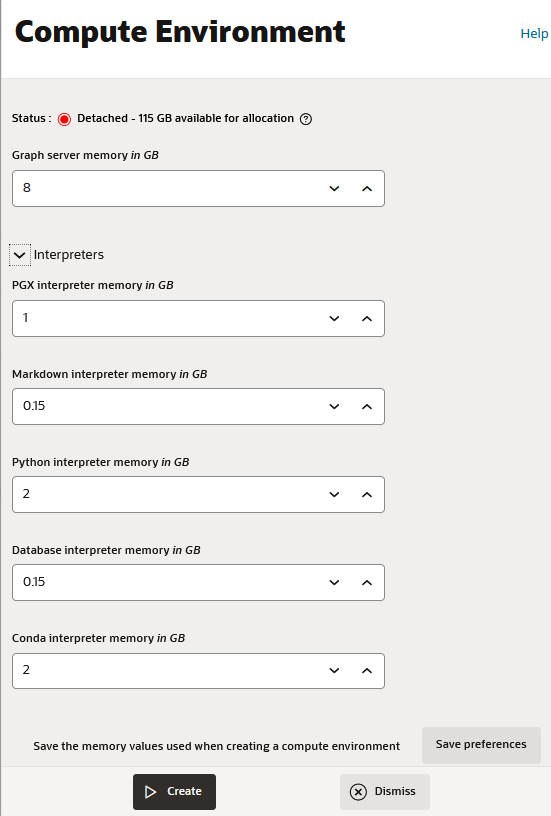
The Compute Environment slider opens as shown:
You can view the following environment details:- Status of your compute
environment.
The compute environment can be available in one of the following states:
State Description Attached Graph Studio is currently attached to a compute environment. Attaching Graph Studio is currently in the process of attaching to a compute environment. Detached Graph Studio is currently not attached to any compute environment Detaching Graph Studio is currently in the process of detaching from a compute environment If the compute environment status is Attached, then you can also view the total amount of memory allocated to the environment.
- Graph server memory configuration.
- Click Interpreters to view the memory configuration for the interpreters.
- Status of your compute
environment.

