Visualize a Dynamic Graph

Graph Studio allows you to visualize the evolution of a graph over time. This time-based analysis provides great insights on the graph data.

To visualize a dynamic graph, you must have a date or a time property in your graph data. It can either be a vertex or an edge property.

You must then configure the graph visualization settings to use these properties as shown in the following steps:
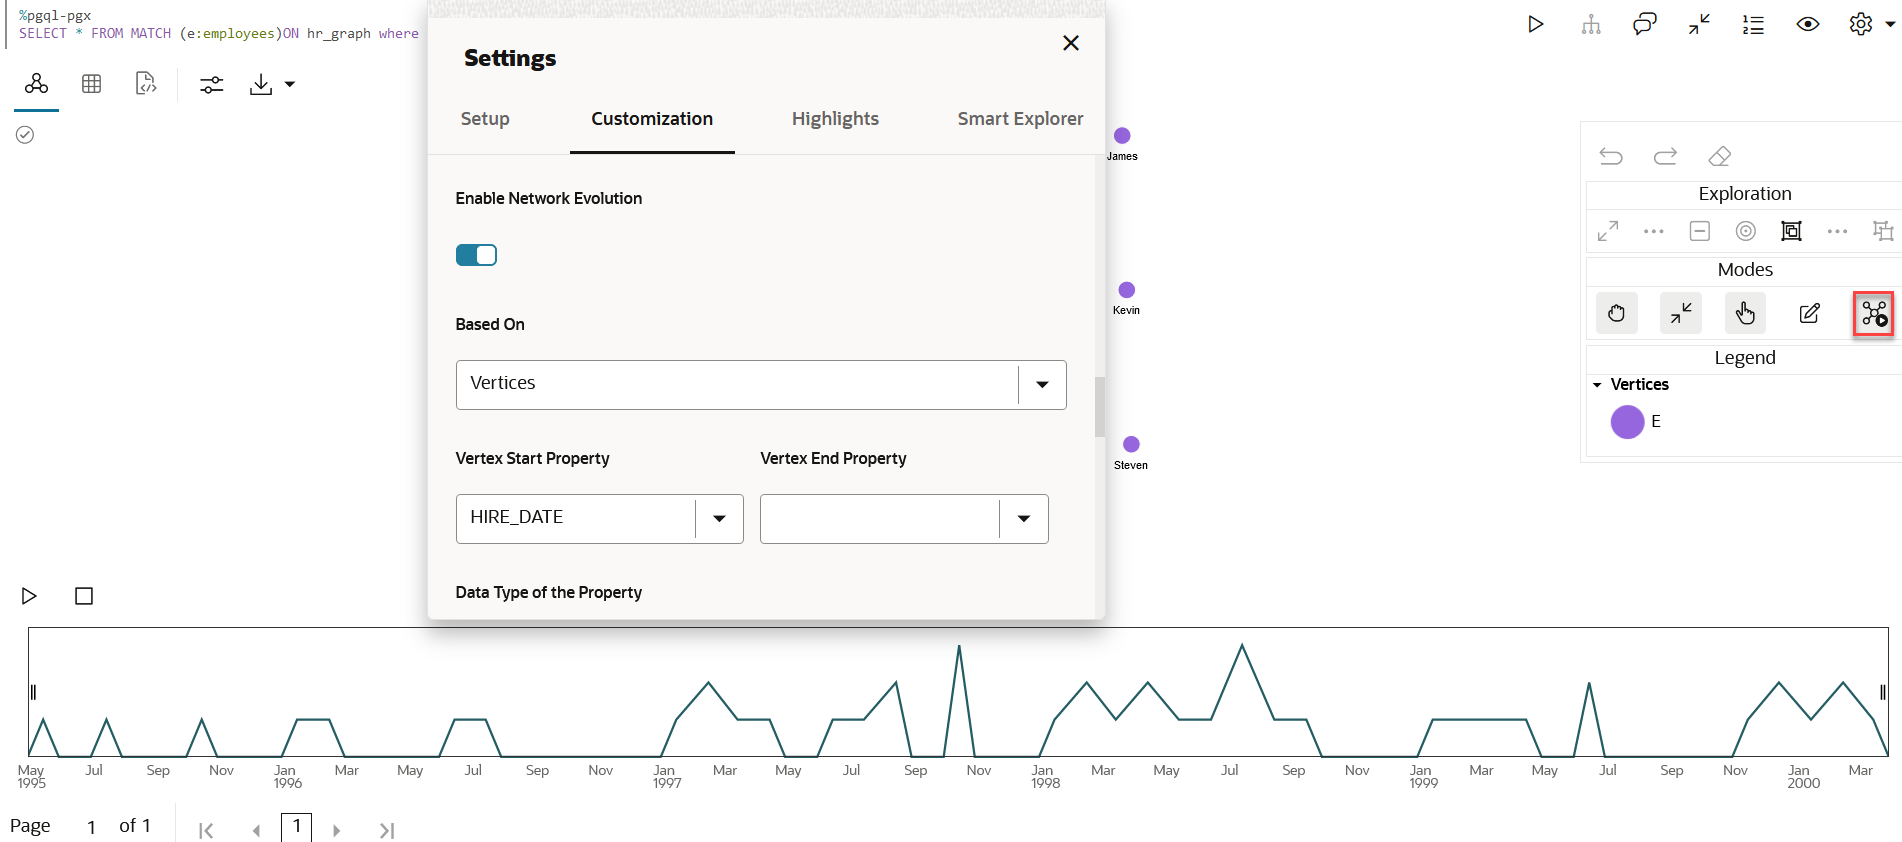
  1. Click Settings on the Visualization panel.
    This opens the Settings dialog.
  2. Click the Customization tab.
  3. Switch on the Enable Network Evolution toggle.
  4. Select a network element from the Based On drop-down list.

    You can configure the network evolution to be based on vertices or edges or both.

    Depending on your selection, you must select one or more of the following properties:
    • Vertex Start Property: Select the name of the property to use for the vertex filtering.

      The time frame for the graph will be after the Vertex Start Property.

    • Vertex End Property: Optionally, select the name of the property to use for the vertex filtering.

      The time frame for the graph will be before the Vertex End Property.

    • Edge Start Property: Select the name of the property to use for the edge filtering.

      The time frame for the graph will be after the Edge Start Property.

    • Edge End Property: Optionally, select the name of the property to use for the edge filtering.

      The time frame for the graph will be before the Edge End Property.

  5. Select the data type value from the Data Type of the Property drop-down list.

    Note that Graph Studio supports only Integer and Date type property values.

  6. Optionally, enable Advanced Settings if you want to explore advanced network evolution features and select one or more of the following options:
    • Values to Exclude: Select values to additionally filter vertices or edges.
    • Behavior: Select the behavior of the excluded values.
    • Increment: Select the interval size.
    • Chart Type: Select the type of the chart to be used to show the network evolution.
    • Height: Select a value to specify the height of the network evolution chart.
    • Milliseconds Between Steps: Select a value to specify how often does the playback advance in ms.
    • Number of Items per Step: Select a value to specify how many steps are taken per time out during playback.
  7. Click X on the top-right to close the Settings dialog.
    A time bar showing the network evolution of your graph data is displayed at the bottom of the graph visualization as shown:

    Description of network_evolution.png follows
    Description of the illustration network_evolution.png

    You can view the graph animation by clicking the Play Network Evolution button. The animation shows the changes in the graph network over time.
    Additionally, you can activate and deactivate network evolution, by clicking Activate Network Evolution which is show highlighted in the preceding figure.