Visualize a Wind Animation Dataset
You can create a wind animation visualization in Spatial Studio.
The following instructions assume that you have a wind animation enabled GeoRaster dataset and the dataset is already added to the project in the Active Project page. See Create a Wind Animation Dataset and Enable Wind Animation For an Existing GeoRaster Dataset for more information.
-
Click the Visualizations tab on the left pane in the Active Project page.
This lists the various visualization options.
-
Click and drag Map from the list to the visualization window on the right to create a map visualization.
A default base map is displayed with no data visualization layers.
-
Click the Data tab on the left pane in the Active Project page.
This lists all the Datasets that are loaded for the project.
-
Click and drag the desired wind animation dataset from the list to the map view on the right.
The wind animation visualization gets displayed as shown:
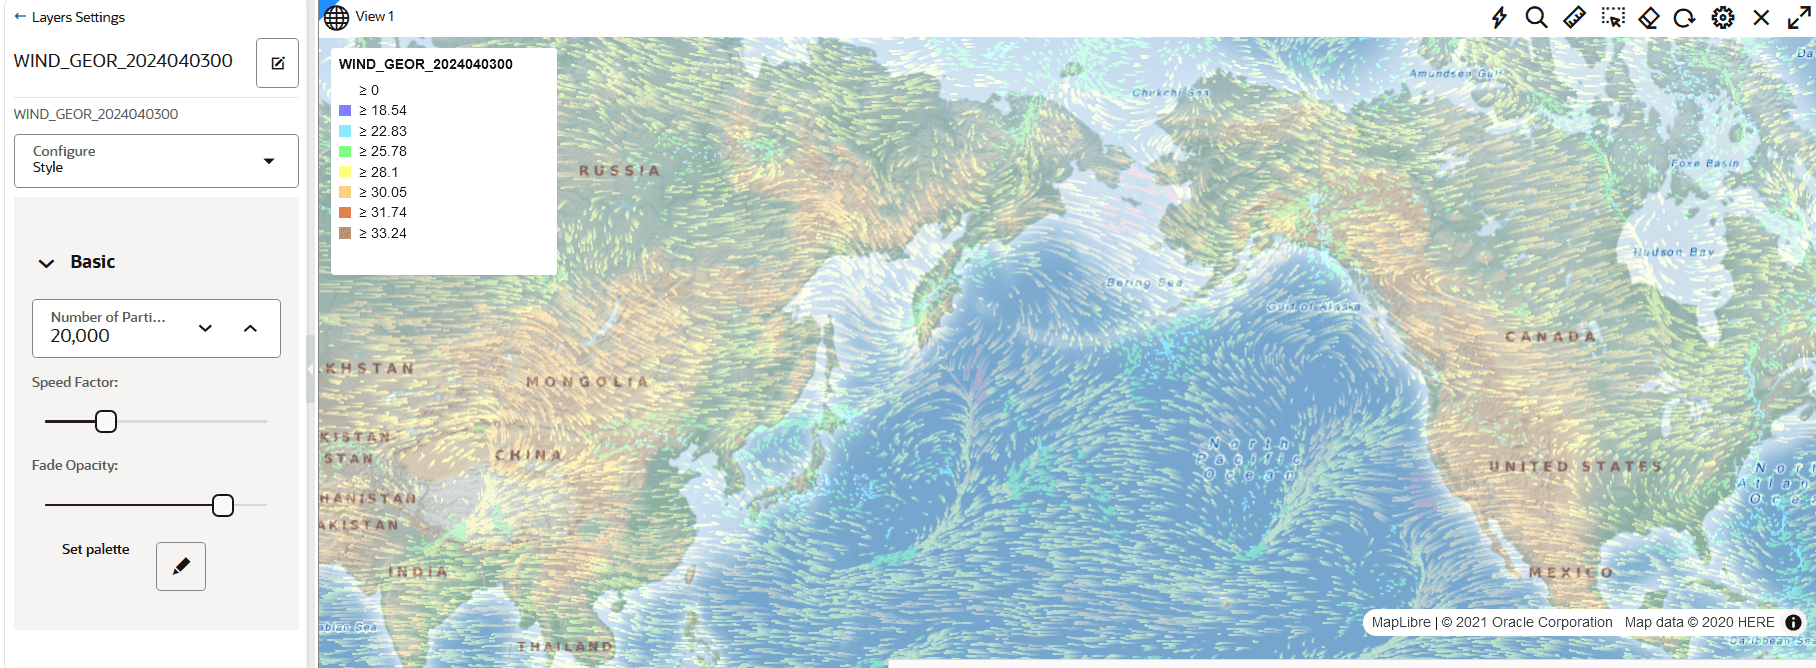
Description of the illustration wind_map_viz.png
Legend using a color scheme is supported for wind animations. However, pitch and rotation actions are not supported. If the view is rotated or pitched, then the wind animation will be disabled, and a warning will be displayed. The wind animation will automatically be reenabled once the pitch/rotate is returned to the default (0).
-
Optionally, click
 against the wind animation dataset layer in the Data tab of the Layers list and configure the following properties.
-
Number of Particles: Controls how many particles are randomly drawn in the current viewport. These particles will be animated based on the wind velocities.
-
Speed Factor: A multiplier between zero and one that adjusts the on-screen movement in relation to the actual wind speed.
-
Fade Opacity: Manages the length of particle trails and when they should fade out, affecting the smoothness of the animation.
-
Set palette: Sets the color scheme for different ranges of wind velocity.
-