15 Validating Data Quality
![]() This topic only applies to Data Integration Platform Cloud Classic.
This topic only applies to Data Integration Platform Cloud Classic.
EDQ provides a comprehensive data quality management environment that is used to understand, improve, protect and govern data quality. EDQ facilitates best practice master data management, data integration, business intelligence, and data migration initiatives. EDQ provides integrated data quality in customer relationship management and other applications.
Following are the key features of EDQ:
-
Integrated data profiling, auditing, cleansing and matching
-
Browser-based client access
-
Ability to handle all types of data (for example, customer, product, asset, financial, and operational)
-
Connection to any Java Database Connectivity (JDBC) compliant data sources and targets
-
Multi-user project support (role-based access, issue tracking, process annotation, and version control)
-
Services Oriented Architecture (SOA) support for designing processes that may be exposed to external applications as a service
-
Designed to process large data volumes
-
A single repository to hold data along with gathered statistics and project tracking information, with shared access
-
Intuitive graphical user interface designed to help you solve real world information quality issues quickly
-
Easy, data-led creation and extension of validation and transformation rules
-
Fully extensible architecture allowing the insertion of any required custom processing
Understanding the Software Components
EDQ is a Java Web Application that uses a Java Servlet Engine, a Java Web Start graphical user interface, and a Structured Query Language (SQL) relational database management system (RDBMS) system for data storage.
EDQ is a client-server architecture. It is comprised of several client applications that are Graphical User Interfaces (GUIs), a data repository, and a business layer. This section provides details on the architecture of these components, their data storage, data access, and I/O requirements.
What Are the Client Applications?
Provides a number of client applications that are used to configure and operate the product. Most are Java Web Start applications, and the remainder are simple web pages. The following table lists all the client applications, how they are started, and what each does:
| Application Name | Starts In | Purpose |
|---|---|---|
|
Director |
Web Start |
Design and test data quality processing |
|
Server Console |
Web Start |
Operate and monitor jobs |
|
Match Review |
Web Start |
Review match results and make manual match decisions |
|
Dashboard |
Browser |
Monitor data quality key performance indicators and trends |
|
Case Management |
Web Start |
Perform detailed investigations into data issues through configurable workflows |
|
Case Management Administration |
Web Start |
Configure workflows and permissions for Case Management |
|
Web Service Tester |
Browser |
Test EDQ Web Services |
|
Configuration Analysis |
Web Start |
Report on configuration and perform differences between versions of configuration |
|
Issue Manager |
Web Start |
Manage a list of DQ issues |
|
Administration |
Browser |
Administer the EDQ server (users, groups, extensions, launchpad configuration) |
|
Change Password |
Browser |
Change password |
|
Configuration Analysis |
Web Start |
Analyze project configurations, and report on differences'. |
The client applications can be accessed from the Launchpad on the server. When a client launches one of the Java Web Start applications, such as Director, the application is downloaded, installed, and run on the client machine. The application communicates with the server to instantiate changes and receive messages from the server, such as information about tasks that are running and changes made by other users.
Since it is an extensible system, it can be extended to add further user applications when installed to work for a particular use case. For example, Oracle Watchlist Screening extends to add a user application for screening data against watchlists.
Note:
Many of the client applications are available either separately (for dedicated use) or within another application. For example, the Configuration Analysis, Match Review and Issue Manager applications are also available in Director.
Where Is Data Stored?
The client computer only stores user preferences for the presentation of the client applications, while all other information is stored on the EDQ server.
Network Communications
The client applications communicate over either an Hypertext Transfer Protocol (HTTP) or a Secure Hypertext Transfer Protocol (HTTPS) connection, as determined by the application configuration on start-up. For simplicity, this connection is referred to as 'the HTTP connection' in the remainder of this document.
How is Data Stored in the EDQ Repository?
EDQ uses a repository that contains two database schemas: the Config schema and the Results schema.
Note:
Each EDQ server must have its own Config and Results schemas. If multiple servers are deployed in a High Availability architecture, then the configuration cannot be shared by pointing both servers to the same schemas.
What Is the Config Schema?
The Config schema stores configuration data for EDQ. It is generally used in the typical transactional manner common to many web applications: queries are run to access small numbers of records, which are then updated as required.
Normally, only a small amount of data is held in this schema. In simple implementations, it is likely to be in the order of several megabytes. In the case of an exceptionally large EDQ system, especially where Case Management is heavily used, the storage requirements could reach 10 GB.
Access to the data held in the Config schema is typical of configuration data in other relational database management system (RDBMS) applications. Most database access is in the form of read requests, with relatively few data update and insert requests.
What Is the Results Schema
The Results schema stores snapshot, staged, and results data. It is highly dynamic, with tables being created and dropped as required to store the data handled by processors running on the server. Temporary working tables are also created and dropped during process execution to store any working data that cannot be held in the available memory.
The amount of data held in the Results schema will vary significantly over time, and data capture and processing can involve gigabytes of data. Data may also be stored in the Results database on a temporary basis while a process or a job runs. In the case of a job, several versions of the data may be written to the database during processing.
The Results schema shows a very different data access profile to the Config schema, and is extremely atypical of a conventional web-based database application. Typically, tables in the Results schema are:
-
Created on demand
-
Populated with data using bulk JDBC application programming interfaces (APIs)
-
Queried using full table scans to support process execution
-
Indexed
-
Queried using complex SQL statements in response to user interactions with the client applications
-
Dropped when the process or snapshot they are associated with is run again
The dynamic nature of this schema means that it must be handled carefully. For example, it is often advisable to mount redo log files on a separate disk.
Where does EDQ Store Working Data on Disk?
EDQ uses two configuration directories, which are separate from the installation directory that contains the program files. These directories are:
-
The base configuration directory: This directory contains default configuration data. This directory is named
oedq.homein an Oracle WebLogic installation but can be named anything in an Apache Tomcat installation. -
The local configuration directory: This directory contains overrides to the base configuration, such as data for extension packs or overrides to default settings. EDQ looks in this directory first, for any overrides, and then looks in the base directory if it does not find the data it needs in the local directory. The local configuration directory is named
oedq.local.homein an Oracle WebLogic installation but can be named anything in an Apache Tomcat installation.
Some of the files in the configuration directories are used when processing data from and to file-based data stores. Other files are used to store server configuration properties, such as which functional packs are enabled, how EDQ connects to its repository databases, and other critical information.
The names and locations of the home and local home directories are important to know in the event that you need to perform any manual updates to templates or other individual components.
These directories are created when you install EDQ.
What Is the Business Layer?
The business layer fulfills three main functions:
-
Provides the API that the client applications use to interact with the rest of the system.
-
Notifies the client applications of server events that may require client applications updates.
-
Runs the processes that capture and process data.
The business layer stores configuration data in the Config schema, and working data and results in the Results schema.
When passing data to and from the client application, the business layer behaves in a manner common to most traditional Java Web Applications. The business layer makes small database transactions and sends small volumes of information to the front-end using the HTTP connection. This is somewhat unusual in that the application front-ends are mostly rich GUIs rather than browsers. Therefore the data sent to the client application consists mostly of serialized Java objects rather than the more traditional HTML.
However, when running processes and creating snapshots, the business layer behaves more like a traditional batch application. In its default configuration, it spawns multiple threads and database connections in order to handle potentially very large volumes of data, and uses all available CPU cores and database I/O capacity.
It is possible to configure EDQ to limit its use of available resources, but this has clear performance implications. For further information, see the EDQ Installation Guide and EDQ Admin Guide.
Understanding Key Concepts of Enterprise Data Quality
This chapters provides the key concepts of EDQ.
Understanding EDQ Terms
The most important terms used in EDQ are:
- Project
-
A group of related processes working on a common set, or sets, of data using shared reference data.
- Data Store
-
A connection to a store of data, whether the data is stored in a database or in one or more files. The data store may be used as the source of data for a process, or you may export the written Staged Data results of a process to a data store, or both.
- Process
-
Specifies a set of actions to be performed on some specified data. It comprises a series of processors, each specifying how data is to be handled and the rules that should be applied to it. A process may produce:
-
Staged data: data or metrics produced by processing the input data and choosing to write output data to the results database.
-
Results data: metric information summarizing the results of the process. For example, a simple validation process may record the number of records that failed and the number of records that passed validation.
-
- Processor
-
A logical element that performs some operation on the data. Processors can perform statistical analysis, audit checks, transformations, matching, or other operations. Processors are chained together to form processes.
- Published Processors
-
Additional processors (in addition to those in the Processor Library) that have been installed from an Extension Pack (such as, the Customer Data pack) or published onto the server by EDQ users. They are included in the Project Browser so that they can be packaged like other objects.There are three types of Published processors: Template, Reference, and Locked Reference
- Reference Data
-
Consists of lists and maps that can be used by a processor to perform checking, matching, transformations and so on. Reference data can be supplied as part of EDQ or by a third party, or can be defined by the user.
- Staged Data
-
Consists of data snapshots and data written by processes and is stored within the Results schema.
- Snapshot
-
A captured copy of external data stored within the EDQ repository.
- Job
-
A configured and ordered set of tasks that may be instigated either by EDQ or externally. Examples of tasks include executions of file downloads, snapshots, processes, and exports.
- Images
-
Customizing the icon associated to a processor.
- Exports
-
There are two types of exports:
-
A prepared export (Staged Data Export or Results Book Export) that uses a saved configuration.
-
An ad-hoc export of the current results from the Results Browser to an Excel file.
-
- Web Services
-
Used to deploy processes (as configured in Director) to provide easy integration with source systems for real time data auditing, cleansing, and matching (for example, for real time duplicate prevention).
- Run Profiles
-
Optional templates that specify configuration settings that you can use to override the default job run settings.
- Issues
-
Allows users to keep a record of their key findings when analyzing data, and also provides a way for work on a project to be allocated and tracked amongst several users.
- Project Notes
-
Allows you to use Director as the definitive repository for all information associated with the project. Any information that needs to be made available to all users working on a project can be added as a note throughout the progress of a project.
What Is Data Capture?
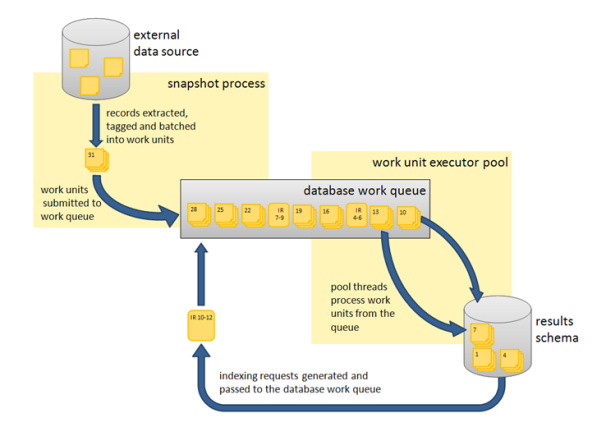
The data capture process begins with retrieving the data to be captured from an external data source. Data can be captured from databases, text files, XML files and so on. For a comprehensive list of possible types of data source, refer to the Data Stores topic in the Concepts section of the Online Help.
Depending on the type of data source, data capture may involve:
-
Running a single SQL query on the source system.
-
Sequentially processing a delimited or fixed format file.
-
Processing an XML file to produce a stream of data.
As the data is retrieved, it is processed by a single thread. This involves:
-
Assigning an internal sequence number to each input record. This is usually a monotonically increasing number for each row.
-
Batching the rows into work units. Once a work unit is filled, it is passed into the results database work queue.
The database work queue is made up of work requests — mostly data insertion or indexing requests — to be executed on the database. The queue is processed by a pool of threads that retrieve work units from the queue, obtain a database connection to the appropriate database, and execute the work. In the case of snapshotting, the work will consist of using the JDBC batch API to load groups of records into a table.
Once all the data has been inserted for a table, the snapshot process creates one or more indexing requests and adds them to the database work queue. At least one indexing request will be created per table to index the unique row identifier, but depending on the volume of data in the snapshot and the configuration of the snapshot process other columns in the captured data may also be used to generate indexes into the snapshot data.
Understanding Network Communications and CPU Load
Snapshotting is expected to generate:
-
I/O and CPU load on the machine hosting the data source while data is read
-
CPU load on the web application server caused by the snapshot process reading data and grouping it for insertion
-
I/O and CPU load on the web application server, caused by the database work unit executor threads
-
A significant amount of I/O on the machine hosting the EDQ Results database as the data is inserted into a new table
-
A significant amount of I/O and some CPU load on machine hosting the Results database as the data is indexed
For example, a default EDQ installation on a 4-core server taking a snapshot of 10,000 rows of data 10 columns wide would generate SQL of the following form:
DROP TABLE DN_1;
CREATE TABLE DN_1 (record-id, column1, column2, ..., column10);
100 bulk insert statements of the form:
INSERT INTO DN_1 (record_id, column1, column2, ..., column10) VALUES ( ?, ?, ..., ? )
each taking a group of 100 parameters. The bulk inserts would be executed in parallel over four separate database connections, one per CPU core.
ANALYZE TABLE DN_1 ESTIMATE STATISTICS SAMPLE 10 PERCENT
And finally, eleven CREATE INDEX... statements, indexing each of the columns in the new table (the original ten columns, plus the record_id). The CREATE INDEX statements would also be executed in parallel over four database connections.
What Is General Data Processing?
Once the data has been captured, it is ready for processing. The reader processor provides the downstream processors with managed access to the data, and the downstream processors produce results data. If any writer processors are present, they will write the results of processing back to the staged data repository.
Running a process causes the web application server to start a number of process execution threads. The default configuration of EDQ will start as many threads as there are cores on the EDQ application server machine.
What Is Streaming?
Instead of capturing data in a snapshot and storing it in the results database (other than temporarily during collation), it can be pulled from a source and pushed to targets as a stream.
What Is Streaming?
Each process execution thread is assigned a subset of the data to process. When the input data for a process is a data set of known size, such as snapshot or staged data, each thread will execute a query to retrieve a subset of the data, identified by the unique row IDs assigned during snapshotting. The queries would be of the form:
SELECT record_id, column1, column2, … , column10
FROM DN_1
WHERE record_id > 0 AND record_id <= 2500;
In the case where the process is not run against a data set of known size, such as a job scheduled to run directly against a data source, records are shared among the process execution threads by reading all records into a queue, which is then consumed by the process execution threads.
Each process execution thread is also made aware of the sequence of processors that comprise the process. The process execution threads pass the records through each of the appropriate processors. As the processors work, they accumulate results that need to be stored in the Results schema and, in the case of writer processors, they may also accumulate data that needs to be written to staged data. All this data is accumulated into insertion groups and added into database work units, which are processed as described in the 4.1 Data capture section.
Once an execution thread has processed all its assigned records, it waits for all other process execution threads to complete. The process execution threads then enter a collation phase, during which the summary data from the multiple copies of the process are accumulated and written to the Results database by the database work queue.
The following behavior is expected during batch processing:
-
Read load on the Results schema as the captured data is read.
-
CPU load on the web application server as the data is processed.
-
Significant write load on the Results schema as results and staged data are written to the schema.
-
Reduced CPU load as the collation phase is entered.
-
A small amount of further database work as any outstanding database work units are processed and accumulated results written.
-
Further write load on the Results schema at the end of the collation phase, in the form of requests to index the results and staged data tables, as necessary. The size and number of the index requests will vary, depending on data volumes and system configuration.
Processes that are heavily built around cleaning and validation operations will tend to be bound by the I/O capacity of the database. Some processors consume significant CPU resource, but generally the speed of operation is determined by how quickly data can be provided from and written to the Results schema.
What Is Whole Record Set Processing?
There are a number of processors, such as the Record Duplication Profiler and Duplicate Check processors, that require access to the whole record set in order to work. If these processors only had access to a subset of the data, they would be unable to detect duplicate records with any accuracy. These processes use multiple threads to absorb the input records and build them into a temporary table. Once all the records have been examined, they are re-emitted by distributing the records amongst the various process execution threads. There is no guarantee that a record will be emitted on the same process execution thread that absorbed it.
What Is Match Processing?
EDQ match processors are handled in a significantly different way from the simpler processors. Due to the nature of the work carried out by match processors, multiple passes through the data are required.
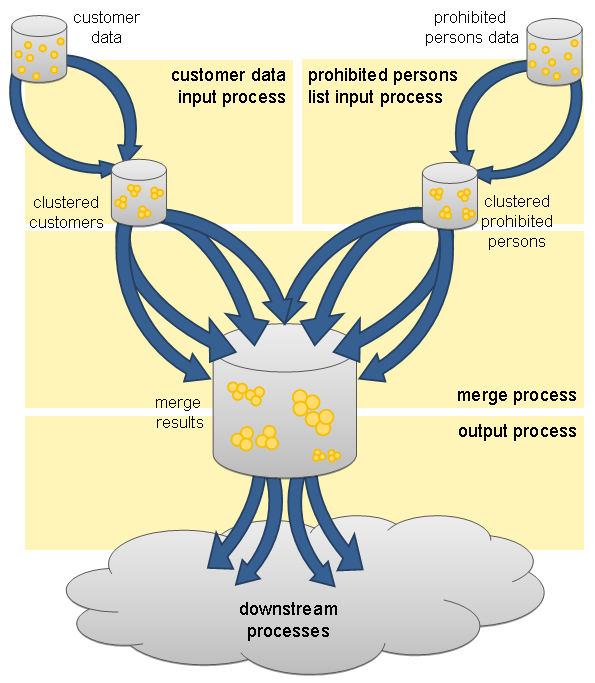
A match processor is executed by treating it as a series of sub-processes. For example, consider a process designed to match a customer data snapshot against a list of prohibited persons. The process contains a match processor that is configured to produce a list of customer reference numbers and related prohibited person identifiers. Each data stream that is input to, or output from, the match processor, is considered to be a sub-process of the match processor. Therefore, there are three sub-processes in this example, representing the customer data input stream, the prohibited persons input stream and the output data stream of the match processor. The match processor itself forms a fourth sub-process, which effectively couples the data inputs to its outputs. Each sub-process is assigned the normal quota of process execution threads, so on a 4-core machine, each sub-process would have four process execution threads.
When execution of the match processor begins, the input data sub-processes run first, processing the input data. At this point, there is no work available for the match or match output sub-processes, which remain dormant. The input data sub-processes generate cluster values for the data streams and store the cluster values and incoming records in the Results schema, using the normal database work units mechanism.
Once the input data sub-processes have processed all the available records, they terminate and commence collation of their sub-process results. Meanwhile, the match sub-process will become active. The match sub-process then works through a series of stages, with each process execution thread waiting for all the other process execution threads to complete each stage before they progress to the next. Each time a new stage begins, the work will be subdivided amongst the processor executor threads in a manner that is appropriate at that stage. The processing stages are:
| Phase | Description |
|---|---|
|
Comparison phase |
The customer data and prohibited people data is retrieved, ordered by cluster values. The data is gathered into groups of equal cluster values, queued and passed to the match process threads to compare the records. Where relationships are found between records the relationship information is written to the Results schema. |
|
Provisional grouping phase |
The relationship information detected during the comparison phase is retrieved in chunks and provisional groups of related records are formed. The relationship chunks are processed in parallel by the match processor threads. These provisional groups are written back to the Results database. |
|
Final grouping phase |
The provisional group table is inspected by a single thread to check for groups that have been artificially split by chunk boundaries. If any such cross-chunk groups are found they are merged into a single group. |
|
Merged output phase |
Each of the match processor threads retrieves an independent subset of the match groups and forms the merged output, merging multiple records into the single output records. |
This completes the match sub-process, and so the match processor execution threads now move into their collation phase.
At this point, the sub-process associated with the output of match data becomes active. The output data is divided amongst the process execution threads for the output sub-process and passed to the processors down stream from the match processor. From this point onwards, the data is processed in the normal batch processing way.
Benchmarks and production experience have shown that the comparison phase of a match processor is one of the few EDQ operations that is likely to become CPU bound. When anything other than very simple comparison operations are performed, the ability of the CPU to handle the comparison load limits the process. The comparison operations scale very well and are perfectly capable of utilizing all CPU cycles available to the EDQ Web Application Server.
Tip:
Oracle recommends that the reader familiarizes themselves with the material contained in the Online Help regarding matching concepts..
What Is Real-Time Processing?
EDQ is capable of processing messages in real time. Currently, EDQ supports messaging using:
-
Web Services
-
JMS-enabled messaging software
When configured for real-time message processing, the server starts multiple process execution threads to handle messages as they are received. An incoming message is handed to a free process execution thread, or placed in a queue to await the next process execution thread to become free. Once the message has been processed, any staged data will be written to the Results database, and the process execution thread will either pick up the next message from the queue, if one exists, or become available for the next incoming message.
When processing data in real time, the process may be run in interval mode. Interval mode allows the process to save results at set intervals so that they can be inspected by a user and published to the EDQ Dashboard. The interval can be determined either by the number of records processed or by time limit. When an interval limit is reached, EDQ starts a new set of process execution threads for the process. Once all the new process execution threads have completed any necessary initialization, any new incoming messages are passed to the new threads. Once the old set of process execution threads have finished processing any outstanding messages, the system directs those threads to enter the collation phase and save any results, after which the old process execution threads are terminated and the data is available for browsing.
Using Enterprise Data Quality
This chapter tells us how to use EDQ.
Adding a Snapshot
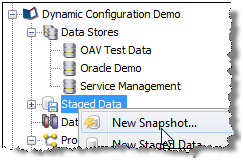
To add a Snapshot of data from a connected data store:
The snapshot is created and visible in the project browser. It is now ready to be run (by Right-click, Run Snapshot), or used in a process and run later. The snapshot may also be 'streamed'; that is, used as a way of selecting the records to be processed from a Data Store directly; that is, without copying them into the repository.
Adding Reference Data
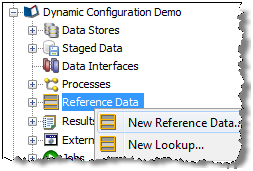
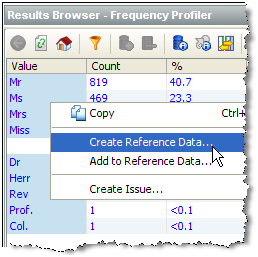
To add a set of Reference Data to use in processors for the validation or transformation of data:
The Reference Data set now appears under your project in the Project Browser, and is ready for use in processors - for example in a List Check.
Adding an Issue
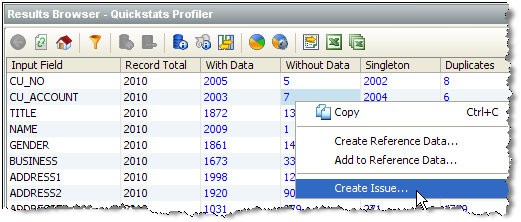
To add an Issue based on your results (for example to tag an item of interest, or to create an action for another user to follow-up on):
The issue is added, and available from the Issue Manager. If the issue was assigned to another user, that user will be notified of the outstanding issue immediately, if he/she is logged on.
Adding a Project Note
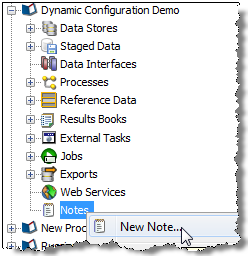
To add a Note to a project, for example to attach a project plan, or to share some key information amongst project users:
The note is created and visible in the Project Browser.
Adding Processors
EDQ comes with a library of processors for processing your data.
To add a processor to your process:
Having successfully created a process, you can now begin to create Reference Data for the validation and transformation of your data.
Configuring Fixed Width Text File Formats
When you define a new data store that connects to a fixed width text file, the New Data Store wizard will prompt you to define the names and sizes of the data fields in the file.
Data in a fixed-width text file is arranged in rows and columns, with one entry per row. Each column has a fixed width, specified in characters, which determines the maximum amount of data it can contain. No delimiters are used to separate the fields in the file. Instead, smaller quantities of data are padded with spaces to fill the allotted space, such that the start of a given column can always be specified as an offset from the beginning of a line. The following file snippet illustrates characteristics common to many flat files. It contains information about cars and their owners, but there are no headings to the columns in the file and no information about the meaning of the data. In addition, the data has been laid out with a single space between each column, for readability:
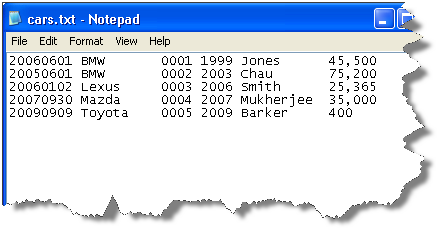
In order to parse the data in a fixed width text file correctly, EDQ needs to be informed of the column sizes implicit in that file. This is done in the New Data Store wizard, and can be edited as part of the data store settings later, if required.
When you first enter the data store configuration screen for a fixed width text file, the columns table is empty. In the following screenshot, it has been populated with the mapping information for some of the columns in our sample file:
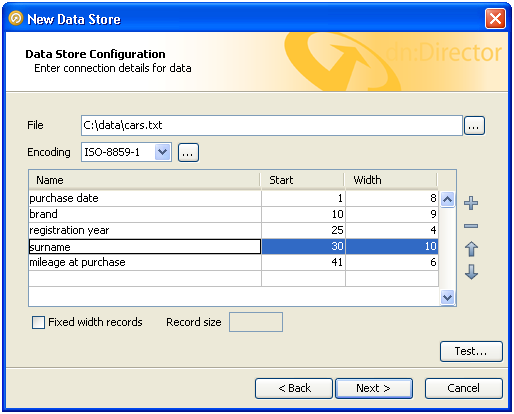
Each column is described to EDQ by its starting position and width, in characters. Each column is also assigned a name, which is used in data snapshots and downstream processing so that the data can be identified. Names are defined by the user at the time the data store is defined and should be descriptive, for maximum downstream usability.
Notice that the positions of the data columns are defined in terms of start point and width. Note also that the first character on a line is at position 1, not zero. Providing a width and a starting point for each column means that EDQ does not assume that one column continues right up until the start of the next, with the result that:
-
Any spaces that have been included in the file for readability, such as a single space between columns, can automatically be bypassed.
-
It is not necessary to define mappings for every column in the file. If un-needed columns exist, they can simply be omitted from the column definitions in the data store configuration. For example, we have not included the third column from the file in our mappings, but because the boundaries of the surrounding columns are tightly defined, no extraneous data will be included in the data set.
-
Columns do not have to be specified in the same order as they occur in the file. The column order specified here will be reflected in any snapshots created from the data source.
The buttons to the right of the columns table can be used to add or remove records, or move the selected record up or down in the list.
Connecting to a Data Store
To connect to a new Data Store in order to process a set of data:
The new data stories are now configured and visible in the Project Browser.
Alternatively, if the data store is going to be shared across projects, you can create it at the System level (outside of any specific project) in the same way as above.
Adding a Project
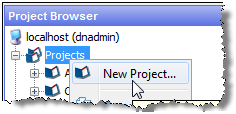
To create a Project for working on a specific set or sets of data:
The new project is created and visible in the Project Browser.
You may want to Add a Note to the project to share amongst project users.
Understanding the Key Tasks In EDQ
This chapter includes the following sections:
About Snapshots
When a Snapshot is configured to run as part of a job, there is a single Enabled? option, which is set by default.
Disabling the option allows you to retain a job definition but to disable the refresh of the snapshot temporarily - for example because the snapshot has already been run and you want to re-run later tasks in the job only.
About Processes
There are a variety of different options available when running a process, either as part of a job, or using the Quick Run option and the Process Execution Preferences.
About Readers
For each Reader in a process, the following option is available:
Sample?
The Sample option allows you to specify job-specific sampling options. For example, you might have a process that normally runs on millions of records, but you might want to set up a specific job where it will only process some specific records that you want to check, such as for testing purposes.
Specify the required sampling using the option under Sampling, and enable it using the Sample option.
The sampling options available will depend on how the Reader is connected.
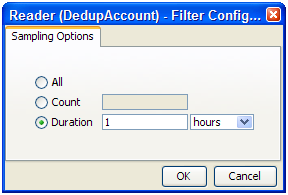
For Readers that are connected to real time providers, you can limit the process so that it will finish after a specified number of records using the Count option, or you can run the process for a limited period of time using the Duration option. For example, to run a real time monitoring process for a period of 1 hour only:
For Readers that are connected to staged data configurations, you can limit the process so that it runs only on a sample of the defined record set, using the same sampling and filtering options that are available when configuring a Snapshot. For example, to run a process so that it only processes the first 1000 records from a data source:
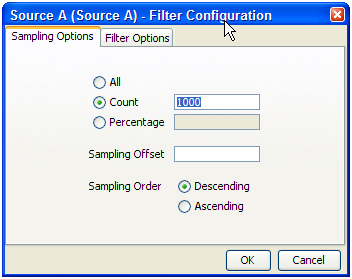
The Sampling Options fields are as follows:
-
All - Sample all records.
-
Count - Sample n records. This will either be the first n records or last n records, depending on the Sampling Order selected.
-
Percentage - Sample n% of the total number of records.
-
Sampling Offset - The number of records after which the sampling should be performed.
-
Sampling Order - Descending (from first record) or Ascending (from last).
Note:
If a Sampling Offset of, for example, 1800 is specified for a record set of 2000, only 200 records can be sampled regardless of the values specified in the Count or Percentage fields.
About Process
The following options are available when running a process, either as part of the Process Execution Preferences, or when running the process as part of a job.
-
Use Intelligent Execution?
Intelligent Execution means that any processors in the process which have up-to-date results based on the current configuration of the process will not re-generate their results. Processors that do not have up-to-date results are marked with the rerun marker. Intelligent Execution is selected by default. Note that if you choose to sample or filter records in the Reader in a process, all processors will re-execute regardless of the Intelligent Execution setting, as the process will be running on a different set of records.
-
Enable Sort/Filter in Match processors?
This option means that the specified Sort/Filter enablement settings on any match processors in the process (accessed via the Advanced Options on each match processor) will be performed as part of the process execution. The option is selected by default. When matching large volumes of data, running the Sort/Filter enablement task to allow match results to be reviewed may take a long time, so you may want to defer it by de-selecting this option. For example, if you are exporting matching results externally, you may want to begin exporting the data as soon as the matching process is finished, rather than waiting until the Enable Sort/Filter process has run. You may even want to over-ride the setting altogether if you know that the results of the matching process will not need to be reviewed.
-
Results Drill Down
This option allows you to choose the level of Results Drill Down that you require.
-
All means that drilldowns will be available for all records that are read in to the process. This is only recommended when you are processing small volumes of data (up to a few thousand records), when you want to ensure that you can find and check the processing of any of the records read into the process.
-
Sample is the default option. This is recommended for most normal runs of a process. With this option selected, a sample of records will be made available for every drilldown generated by the process. This ensures that you can explore results as you will always see some records when drilling down, but ensures that excessive amounts of data are not written out by the process.
-
None means that the process will still produce metrics, but drilldowns to the data will be unavailable. This is recommended if you want the process to run as quickly as possible from source to target, for example, when running data cleansing processes that have already been designed and tested.
-
-
Publish to Dashboard?
This option sets whether or not to publish results to the Dashboard. Note that in order to publish results, you first have to enable dashboard publication on one or more audit processors in the process.
About Run Modes
To support the required Execution Types, EDQ provides three different run modes.
If a process has no readers that are connected to real time providers, it always runs in the Normal mode as mentioned below.
If a process has at least one reader that is connected to a real time provider, the mode of execution for a process can be selected from one of the following three options:
Normal mode
In Normal mode, a process runs to completion on a batch of records. The batch of records is defined by the Reader configuration, and any further sampling options that have been set in the process execution preferences or job options.
Prepare mode
Prepare mode is required when a process needs to provide a real time response, but can only do so where the non real time parts of the process have already run; that is, the process has been prepared.
Prepare mode is most commonly used in real time reference matching. In this case, the same process will be scheduled to run in different modes in different jobs - the first job will prepare the process for real time response execution by running all the non real time parts of the process, such as creating all the cluster keys on the reference data to be matched against. The second job will run the process as a real time response process (probably in Interval mode).
Interval mode
In Interval mode, a process may run for a long period of time, (or even continuously), but will write results from processing in a number of intervals. An interval is completed, and a new one started, when either a record or time threshold is reached. If both a record and a time threshold are specified, then a new interval will be started when either of the thresholds is reached.
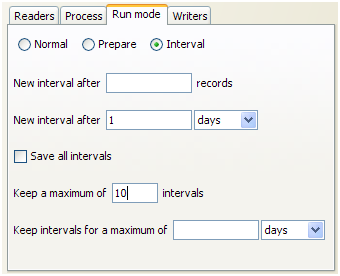
As Interval mode processes may run for long periods of time, it is important to be able to configure how many intervals of results to keep. This can be defined either by the number of intervals, or by a period of time.
For example, the following options might be set for a real time response process that runs on a continuous basis, starting a new interval every day:
Browsing Results from processing in Interval mode
When a process is running in Interval mode, you can browse the results of the completed intervals (as long as they are not too old according to the specified options for which intervals to keep).
The Results Browser presents a simple drop-down selection box showing the start and end date and time of each interval. By default, the last completed interval is shown. Select the interval, and browse results:

If you have the process open when a new set of results becomes available, you will be notified in the status bar:
You can then select these new results using the drop-down selection box.
About Writers
For each Writer in a process, the following options are available:
-
Write Data?
This option sets whether or not the writer will 'run'; that is, for writers that write to stage data, de-selecting the option will mean that no staged data will be written, and for writers that write to real time consumers, de-selecting the option will mean that no real time response will be written.
This is useful in two cases:
-
You want to stream data directly to an export target, rather than stage the written data in the repository, so the writer is used only to select the attributes to write. In this case, you should de-select the Write Data option and add your export task to the job definition after the process.
-
You want to disable the writer temporarily, for example, if you are switching a process from real time execution to batch execution for testing purposes, you might temporarily disable the writer that issues the real time response.
-
-
Enable Sort/Filter?
This option sets whether or not to enable sorting and filtering of the data written out by a Staged Data writer. Typically, the staged data written by a writer will only require sorting and filtering to be enabled if it is to be read in by another process where users might want to sort and filter the results, or if you want to be able to sort and filter the results of the writer itself.
The option has no effect on writers that are connected to real time consumers.
About External Tasks
Any External Tasks (File Downloads, or External Executables) that are configured in a project can be added to a Job in the same project.
When an External Task is configured to run as part of a job, there is a single Enabled? option.
Enabling or Disabling the Enable export option allows you to retain a job definition but to enable or disable the export of data temporarily.
About Exports
When an Export is configured to run as part of a job, the export may be enabled or disabled (allowing you to retain a Job definition but to enable or disable the export of data temporarily), and you can specify how you want to write data to the target Data Store, from the following options:
Delete current data and insert (default)
EDQ deletes all the current data in the target table or file and inserts the in-scope data in the export. For example, if it is writing to an external database it will truncate the table and insert the data, or if it is writing to a file it will recreate the file.
Append to current data
EDQ does not delete any data from the target table or file, but adds the in-scope data in the export. When appending to a UTF-16 file, use the UTF-16LE or UTF-16-BE character set to prevent a byte order marker from being written at the start of the new data.
Replace records using primary key
EDQ deletes any records in the target table that also exist in the in-scope data for the export (determined by matching primary keys) and then inserts the in-scope data.
Note:
-
When an Export is run as a standalone task in Director (by right-clicking on the Export and selecting Run), it always runs in Delete current data and insert mode.
-
Delete current data and insert and Replace records using primary key modes perform Delete then Insert operations, not Update. It is possible that referential integrity rules in the target database will prevent the deletion of the records, therefore causing the Export task to fail. Therefore, in order to perform an Update operation instead, Oracle recommends the use of a dedicated data integration product, such as Oracle Data Integrator.
Editing a Job
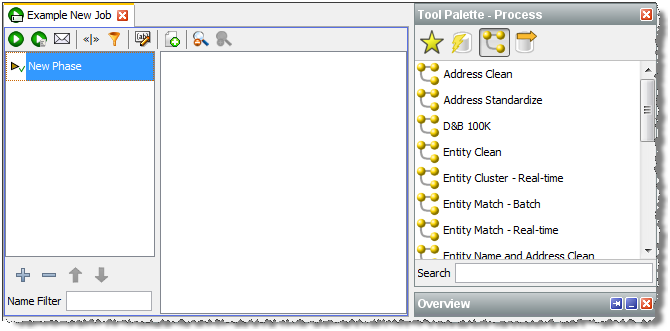
- To edit a Job, locate it within the Project Browser and either double click it or right-click and select Edit....
- The Job is displayed in the Job Canvas. Edit the Phases and/or Tasks as required.
- Click File >Save.
About Exports
When an Export is configured to run as part of a job, the export may be enabled or disabled (allowing you to retain a Job definition but to enable or disable the export of data temporarily), and you can specify how you want to write data to the target Data Store, from the following options:
Delete current data and insert (default)
EDQ deletes all the current data in the target table or file and inserts the in-scope data in the export. For example, if it is writing to an external database it will truncate the table and insert the data, or if it is writing to a file it will recreate the file.
Append to current data
EDQ does not delete any data from the target table or file, but adds the in-scope data in the export. When appending to a UTF-16 file, use the UTF-16LE or UTF-16-BE character set to prevent a byte order marker from being written at the start of the new data.
Replace records using primary key
EDQ deletes any records in the target table that also exist in the in-scope data for the export (determined by matching primary keys) and then inserts the in-scope data.
Note:
-
When an Export is run as a standalone task in Director (by right-clicking on the Export and selecting Run), it always runs in Delete current data and insert mode.
-
Delete current data and insert and Replace records using primary key modes perform Delete then Insert operations, not Update. It is possible that referential integrity rules in the target database will prevent the deletion of the records, therefore causing the Export task to fail. Therefore, in order to perform an Update operation instead, Oracle recommends the use of a dedicated data integration product, such as Oracle Data Integrator.
Deleting a Job
Deleting a job does not delete the processes that the Job contained, and nor does it delete any of the results associated with it. However, if any of the processes contained in the Job were last run by the Job, the last set of results for that process will be deleted. This will result in the processors within that process being marked as out of date.
To delete a Job, either:
-
select it in the Project Browser and press the Delete key; or
-
right-click the job and select Delete.
Remember that it is not possible to delete a Job that is currently running.
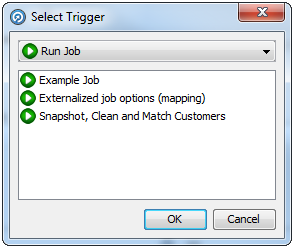
Using Job Triggers
Job Triggers are used to start or interrupt other Jobs. Two types of triggers are available by default:
-
Run Job Triggers: used to start a Job.
-
Shutdown Web Services Triggers: used to shut down real-time processes.
Further Triggers can be configured by an Administrator, such as sending a JMS message or calling a Web Service. They are configured using the Phase Configuration dialog, an example of which is provided below:
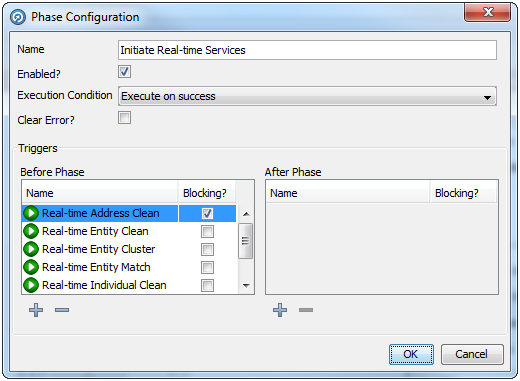
Triggers can be set before or after a Phase. A Before Trigger is indicated by a blue arrow above the Phase name, and an After Trigger is indicated by a red arrow below it. For example, the following image shows a Phase with Before and After Triggers:
Triggers can also be specified as Blocking Triggers. A Blocking Trigger prevents the subsequent Trigger or Phase beginning until the task it triggers is complete.
Deleting a Trigger from a Job
- Right-click the required Phase and select Configure.
- In the Phase Configuration dialog, find the Trigger selected for deletion and click it.
- Click the Delete Trigger button under the list of the selected Trigger. The Trigger is deleted.
- Click OK to save changes. However, if a Trigger is deleted in error, click Cancel instead.
Creating and Managing Processors
In addition to the range of data quality processors available in the Processor Library, EDQ allows you to create and share your own processors for specific data quality functions.
There are two ways to create processors:
-
Using an external development environment to write a new processor - see the Extending EDQ topic in online help on oracle doc center for more details.
-
Using EDQ to create processors - read on in this topic for more details
Creating a Processor From a Sequence of Configured Processors
EDQ allows you to create a single processor for a single function using a combination of a number of base (or 'member') processors used in sequence.
Note that the following processors may not be included in a new created processor:
-
Parse
-
Match
-
Group and Merge
-
Merge Data Sets
A single configured processor instance of the above processors may still be published, however, in order to reuse the configuration.
Processor creation example
To take a simple example, you may want to construct a reusable Add Gender processor that derives a Gender value for individuals based on Title and Forename attributes. To do this, you have to use a number of member processors. However, when other users use the processor, you only want them to configure a single processor, input Title and Forename attributes (however they are named in the data set), and select two Reference Data sets - one to map Title values to Gender values, and one to map Forename values to Gender values. Finally, you want three output attributes (TitleGender, NameGender and BestGender) from the processor.
To do this, you need to start by configuring the member processors you need (or you may have an existing process from which to create a processor). For example, the screenshot below shows the use of 5 processors to add a Gender attribute, as follows:
- Derive Gender from Title (Enhance from Map).
- Split Forename (Make Array from String).
- Get first Forename (Select Array Element).
- Derive Gender from Forename (Enhance from Map).
- Merge to create best Gender (Merge Attributes).

To make these into a processor, select them all on the Canvas, right-click, and select Make Processor.
This immediately creates a single processor on the Canvas and takes you into a processor design view, where you can set up how the single processor will behave.
Setting Inputs
The inputs required by the processor are calculated automatically from the configuration of the base processors. Note that where many of the base processors use the same configured input attribute(s), only one input attribute will be created for the new processor.
However, if required you can change or rename the inputs required by the processor in the processor design view, or make an input optional. To do this, click on the Processor Setup icon at the top of the Canvas, then select the Inputs tab.

In the case above, two input attributes are created - Title and Forenames, as these were the names of the distinct attributes used in the configuration of the base processors.
The user chooses to change the External Label of one of these attributes from Forenames to Forename to make the label more generic, and chooses to make the Forename input optional:
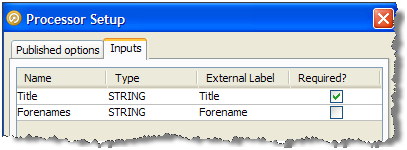
Note that if an input attribute is optional, and the user of the processor does not map an attribute to it, the attribute value will be treated as Null in the logic of the processor.
Note:
It is also possible to change the Name of each of the input attributes in this screen, which means their names will be changed within the design of the processor only (without breaking the processor if the actual input attributes from the source data set in current use are different). This is available so that the configuration of the member processors matches up with the configuration of the new processor, but will make no difference to the behavior of the created processor.
Setting Options
The processor design page allows you to choose the options on each of the member processors that you want to expose (or "publish") for the processor you are creating. In our example, above, we want the user to be able to select their own Reference Data sets for mapping Title and Forename values to Gender values (as for example the processor may be used on data for a new country, meaning the provided Forename to Gender map would not be suitable).
To publish an option, open the member processor in the processor design page, select the Options tab, and tick the Show publishing options box at the bottom of the window.
You can then choose which options to publish. If you do not publish an option, it will be set to its configured value and the user of the new processor will not be able to change it (unless the user has permission to edit the processor definition).
There are two ways to publish options:
-
Publish as New - this exposes the option as a new option on the processor you are creating.
-
Use an existing published option (if any) - this allows a single published option to be shared by many member processors. For example, the user of the processor can specify a single option to Ignore Case which will apply to several member processors.
Note:
If you do not publish an option that uses Reference Data, the Reference Data will be internally packaged as part of the configuration of the new processor. This is useful where you do not want end users of the processor to change the Reference Data set.
In our example, we open up the first member processor (Derive Gender from Title) and choose to publish (as new) the option specifying the Reference Data set used for mapping Title values to Gender values:
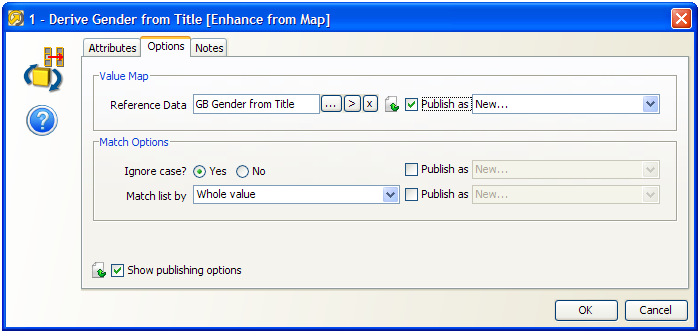
Note above that the Match Options are not published as exposed options, meaning the user of the processor will not be able to change these.
We then follow the same process to publish the option specifying the Reference Data set used for mapping Forename values to Gender values on the fourth processor (Derive Gender from Forename).
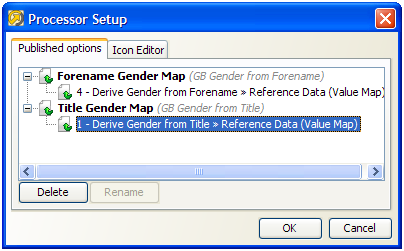
Once we have selected the options that we want to publish, we can choose how these will be labeled on the new processor.
To do this, click on Processor Setup button at the top of the canvas and rename the options. For example, we might label the two options published above Title Gender Map and Forename Gender Map:
Setting Output Attributes
The Output Attributes of the new processor are set to the output attributes of any one (but only one) of the member processors.
By default, the final member processor in the sequence is used for the Output Attributes of the created processor. To use a different member processor for the output attributes, click on it, and select the Outputs icon on the toolbar:

The member processor used for Outputs is marked with a green shading on its output side:

Note:
Attributes that appear in Results Views are always exposed as output attributes of the new processor. You may need to add a member processor to profile or check the output attributes that you want to expose, and set it as the Results Processor (see below) to ensure that you see only the output attributes that you require in the new processor (and not for example input attributes to a transformation processor). Alternatively, if you do not require a Results View, you can unset it and the exposed output attributes will always be those of the Outputs processor only.
Setting Results Views
The Results Views of the new processor are set to those of any one (but only one) of the member processors.
By default, the final member processor in the sequence is used for the Results of the created processor. To use a different member processor for the results views, click on it, and select the Results icon on the toolbar:

The member processor used for Results is now marked with an overlay icon:

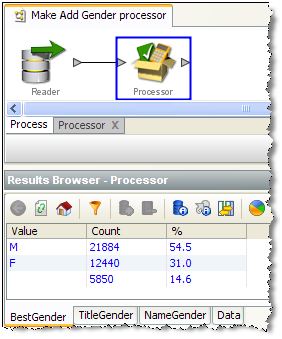
Note that in some cases, you may want to add a member processor specifically for the purpose of providing Results Views. In our example, we may want to add a Frequency Profiler of the three output attributes (TitleGender, ForenameGender and BestGender) so that the user of a new processor can see a breakdown of what the Add Gender processor has done. To do this, we add a Frequency Profiler in the processor design view, select the three attributes as inputs, select it as our Results Processor and run it.
If we exit the processor designer view, we can see that the results of the Frequency Profiler are used as the results of the new processor:
Setting Output Filters
The Output Filters of the new processor are set to those of any one (and only one) of the member processors.
By default, the final member processor in the sequence is used for the Output Filters of the created processor. To use a different member processor, click on it, and select the Filter button on the toolbar:

The selected Output Filters are colored green in the processor design view to indicate that they will be exposed on the new processor:

Setting Dashboard Publication Options
The Dashboard Publication Options of the new processor are set to those of any one (and only one) of the member processors.
If you require results from your new processor to be published to the Dashboard, you need to have an Audit processor as one of your member processors.
To select a member processor as the Dashboard processor, click on it and select the Dashboard icon on the toolbar:

The processor is then marked with a traffic light icon to indicate that it is the Dashboard Processor:

Note:
In most cases, it is advisable to use the same member processor for Results Views, Output Filters, and Dashboard Publication options for consistent results when using the new processor. This is particularly true when designing a processor designed to check data.
Setting a Custom Icon
You may want to add a custom icon to the new processor before publishing it for others to use. This can be done for any processor simply by double-clicking on the processor (outside of the processor design view) and selecting the Icon & Group tab.
See the Customizing Processor Icons for more details.
Once you have finished designing and testing your new processor, the next step is to publish it for others to use.
Customizing Processor Icons
It is possible to customize the icon for any processor instance in EDQ. This is one way of distinguishing a configured processor, which may have a very specific purpose, from its generic underlying processor. For example, a Lookup Check processor may be checking data against a specific set of purchased or freely available reference data, and it may be useful to indicate that reference data graphically in a process.
The customization of a processor icon is also useful when creating and publishing new processors. When a processor has been published, its customized icons becomes the default icon when using the processor from the Tool Palette.
To customize a processor icon:
- Double-click on a processor on the Canvas
- Select the Icon & Family tab
- To change the processor icon (which appears at the top right of the image), use the left side of the screen.
- To change the family icon, use the right side of the screen (Note that when publishing a processor, it will be published into the selected group, or a new family created if it does not yet exist)
- For both processor and family icons, a dialog is launched showing the server image library. You can either select an existing image, or create a new image.
- If adding a new image, a dialog is shown allowing you to browse for (or drag and drop) an image, resize it, and enter a name and optional description.
Once an image has been created on a server, it is added to the server's image library and available whenever customizing an icon. The image library on a server can be accessed by right-clicking on a server in the Project Browser, and selecting Images...
Publishing Processors
Configured single processors can be published to the Tool Palette for other users to use on data quality projects.
It is particularly useful to publish the following types of processor, as their configuration can easily be used on other data sets:
-
Match processors (where all configuration is based on Identifiers)
-
Parse processors (where all configuration is based on mapped attributes)
-
Processors that have been created in EDQ (where configuration is based on configured inputs)
Published processors appear both in the Tool Palette, for use in processes, and in the Project Browser, so that they can be packaged for import onto other EDQ instances.
Note:
The icon of the processor may be customized before publication. This also allows you to publish processors into new families in the Tool Palette.
To publish a configured processor, use the following procedure:
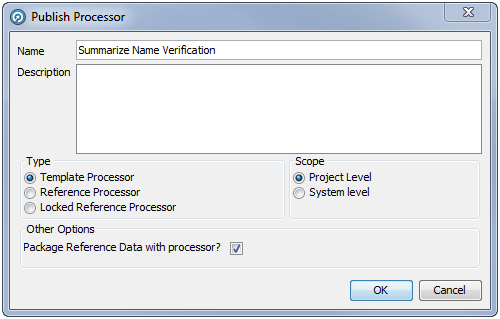
Note:
Options that externalized on the published processor always require Reference Data to be made available (either in the project or at system level. Options that are not externalized on the published processor can either have their Reference Data supplied with the published processor (the default behavior with this option selected) or can still require Reference Data to be made available. For example, to use a standard system-level Reference Data set.
Editing a Published Processor
Published processors can be edited in the same way as a normal processor, although they must be republished once any changes have been made.
If a Template Published processor is edited and published, only subsequent instances of that processor will be affected, as there is no actual link between the original and any instances.
If a Reference or Locked Reference Published processor is reconfigured, all instances of the process will be modified accordingly. However, if an instance of the processor is in use when the original is republished, the following dialog is displayed:

Attaching Help to Published Processors
It is possible to attach Online Help before publishing a processor, so that users of it can understand what the processor is intended to do.
The Online Help must be attached as a zip file containing an file named index.htm (or index.html), which will act as the main help page for the published processors. Other html pages, as well as images, may be included in the zip file and embedded in, or linked from, the main help page. This is designed so that a help page can be designed using any HTML editor, saved as an HTML file called index.htm and zipped up with any dependent files.
To do this, right-click the published processor and select Attach Help. This will open a file browsing dialog which is used to locate and select the file.
Note:
The Set Help Location option is used to specify a path to a help file or files, rather than attaching them to a processor. This option is intended for Solutions Development use only.
If a processor has help attached to it, the help can be accessed by the user by selecting the processor and pressing F1. Note that help files for published processors are not integrated with the standard EDQ Online Help that is shipped with the product, so are not listed in its index and cannot be found by search.
Publishing Processors Into Families
It is possible to publish a collection of published processors with a similar purpose into a family on the Tool Palette. For example, you may create a number of processors for working with a particular type of data and publish them all into their own family.
To do this, you must customize the family icon of each processor before publication, and select the same icon for all the processors you want to publish into the same family. When the processor is published, the family icon is displayed in the Tool Palette, and all processors that have been published and which use that family icon will appear in that family. The family will have the same name as the name given to the family icon.
For more information, see:
Using the Event Log
The Event Log provides a complete history of all jobs and tasks that have run on an EDQ server.
By default, the most recent completed events of all types are shown in the log. However, you can filter the events using a number of criteria to display the events that you want to see. It is also possible to tailor the Event Log by changing the columns that are displayed in the top-level view. Double-clicking on an event will display further information where it is available.
The displayed view of events by any column can be sorted as required. However, older events are not displayed by default, so a filter must be applied before sorting before they can be viewed.
About Logged Events
An event is added to the Event Log whenever a Job, Task, or System Task either starts or finishes.
Tasks are run either as part of Jobs or individually instigated using the Director UI.
The following types of Task are logged:
-
Process
-
Snapshot
-
Export
-
Results Export
-
External Task
-
File Download
The following types of System Task are logged:
-
OFB - a System Task meaning 'Optimize for Browse' - this optimizes written results for browsing in the Results Browser by indexing the data to enable sorting and filtering of the data. The 'OFB' task will normally run immediately after a Snapshot or Process task has run, but may also be manually instigated using the EDQ client by right-clicking on a set of Staged Data and selecting Enable Sort/Filter, or by a user attempting to sort or filter on a non-optimized column, and choosing to optimize it immediately.
-
DASHBOARD - a System Task to publish results to the Dashboard. This runs immediately after a Process task has been run with the Publish to Dashboard option checked.
About Server Selection
If the Director UI is connected to multiple servers, you can switch servers using the Server drop-down field in the top-left hand corner.
If Server Console UI is connected to multiple servers, select the required server in the tab list at the top of the window.
About Filtering Events
Quick filters
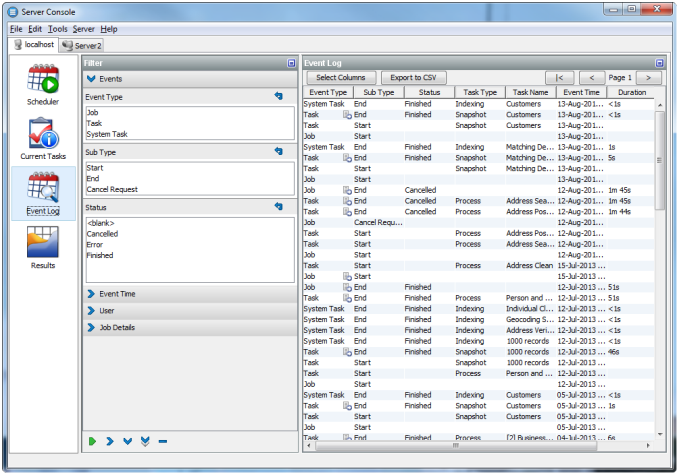
Quick filter options are made available to filter by Event Type, Status and Task Type. Simply select the values that you want to include in the filter (using Control - Select to select multiple items) and click on the Run Filter button on the bottom left of the screen to filter the events.
For example:
Free-text filters (search ahead)
Further free-text filtering options are available to filter by Project Name, Job Name, Task Name and User Name. These are free-text so that you can enter partial names into the fields. You can enter a partial name into any of these fields - provided the object contains the partial name, it will be displayed (though note that matching is case-sensitive). For example, if you use a naming convention where all projects working on live systems have a name including the word 'Live' you can display all events for live systems as follows:
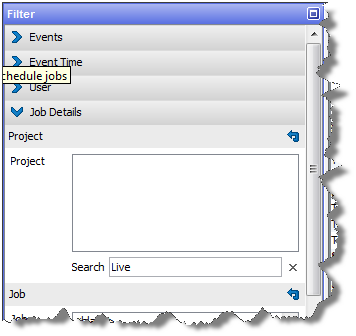
Note:
The Project Name column is not displayed by default. To change the view to see it, click the Select Columns button on the left hand side, and check the Project Name box.
Date/time filters
The final set of filters, on the right-hand side of the screen, allow you to filter the list of events by date and time. A Date picker is provided to make it easier to specify a given date. Note that although only the most recent events are shown when accessing the Event Log, it is possible to apply filters to view older events if required.
Note:
Events are never deleted from the history by EDQ, though they are stored in the repository and may be subject to any custom database-level archival or deletion policies that have been configured on the repository database.
Events may be filtered by their start times and/or by their end times. For example, to see all Jobs and Tasks (but not System Tasks) that completed in the month of November 2008, apply filters as follows:
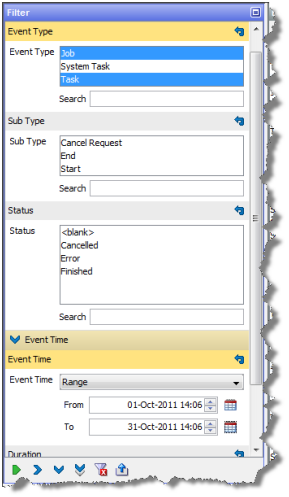
Column selection
To change the set of columns that are displayed on the Event Log, click the Select Columns button on the top left of the Event Log area. The Select Columns dialog is displayed. Select or deselect the columns as required, and click OK or save or Cancel to abandon the changes. Alternatively, click Default to restore the default settings:
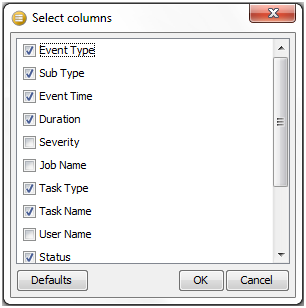
Note that Severity is a rarely used column - it is currently set to 50 for tasks or jobs that completed correctly, and 100 for tasks or jobs that raised an error or a warning.
Opening an event
Double-clicking to open an event will reveal further detail where it is available.
Opening a Task will display the Task Log, showing any messages that were generated as the task ran:
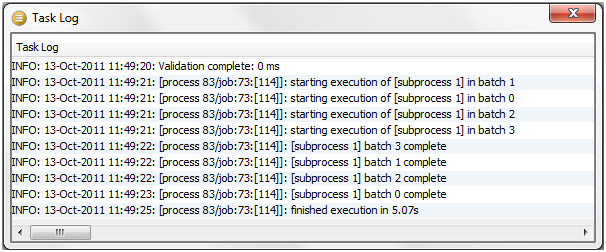
Note:
Messages are classified as INFO, WARNING, or SEVERE. An INFO message is for information purposes and does not indicate a problem. A WARNING message is generated to indicate that there could be an issue with the process configuration (or data), but this will not cause the task to error. SEVERE messages are generated for errors in the task.
For Jobs, if a notification email was configured on the job, the notification email will be displayed in a web browser when opening the completed event for the Job. Jobs with no notifications set up hold no further information.
Exporting data from the Event Log
It is possible to export the viewable data in the Event Log to a CSV file. This may be useful if you are in contact with Oracle Support and they require details of what has run on the server.
To export the current view of events, click Export to CSV. This will launch a browser on the client for where to write the CSV file. Give the file a name and click Export to write the file.
