Create and View Business Analytics Dashboards
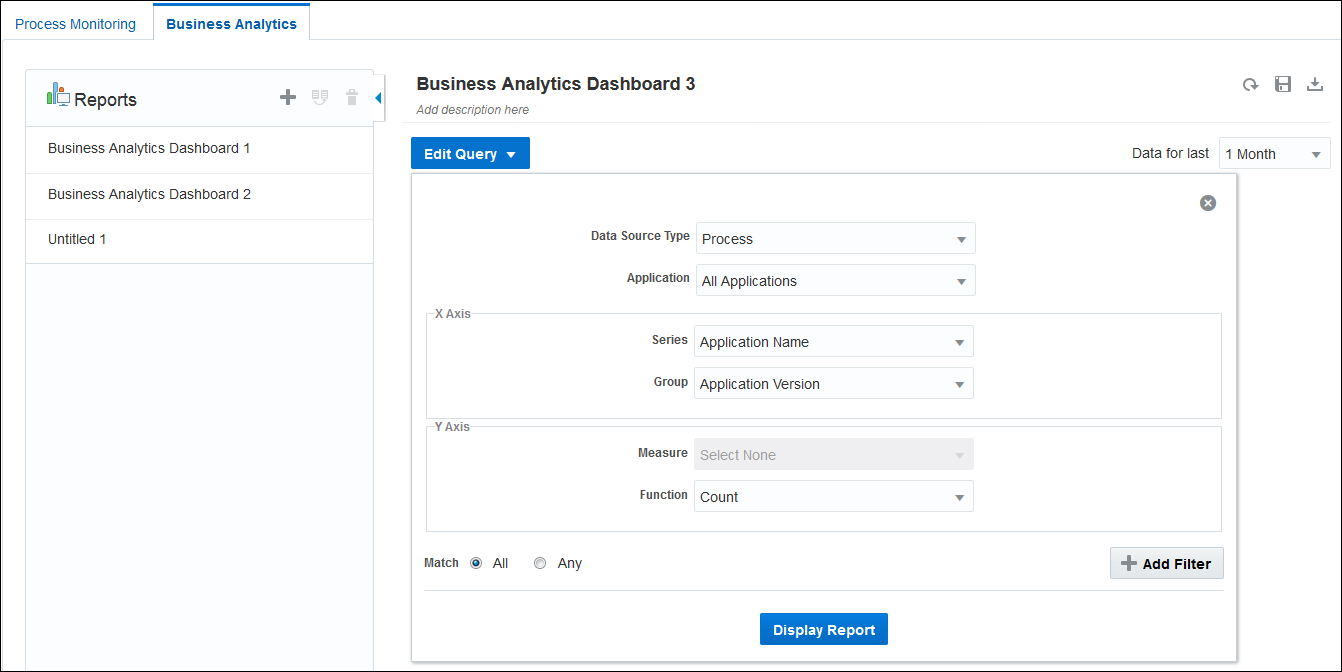
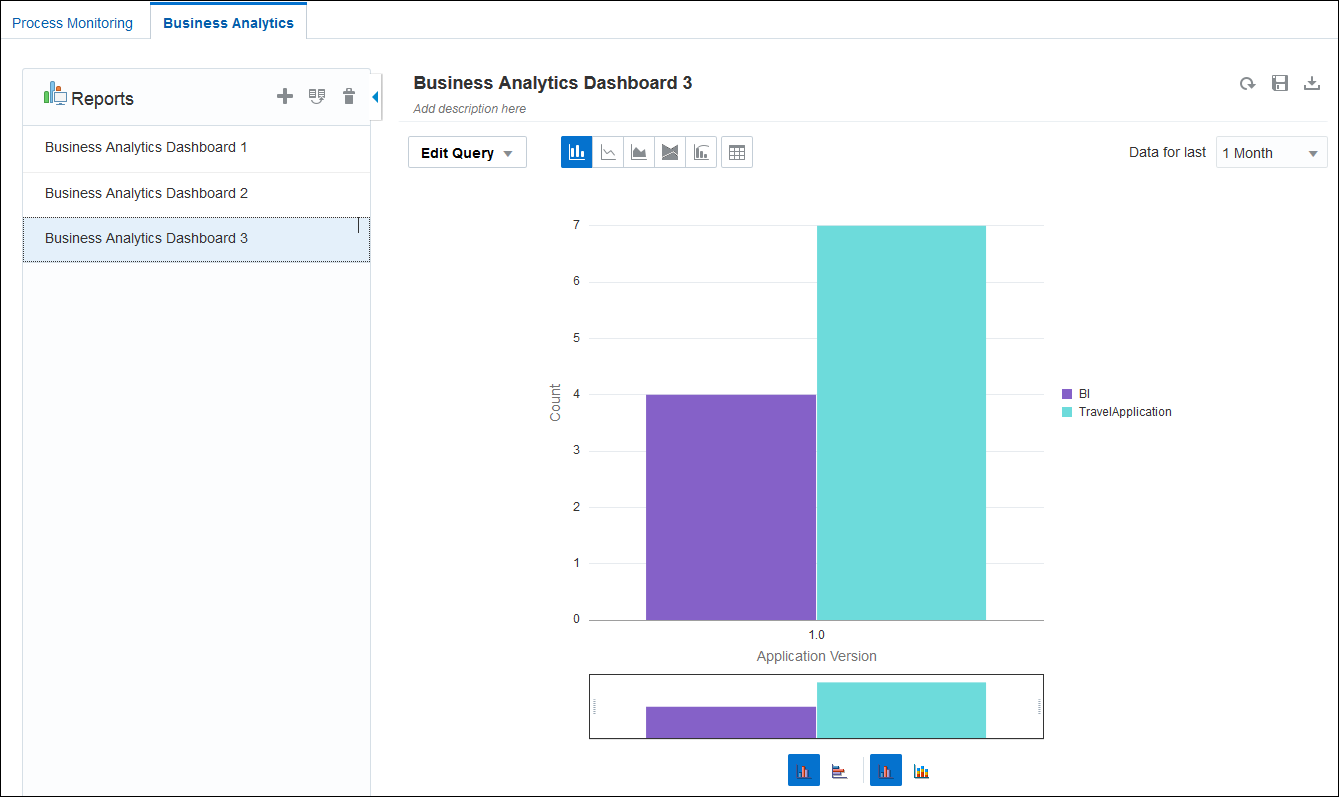
Use the Business Data Query to plot and view charts and graphs for application metrics and create Business Analytics Dashboards. You can create charts that display business indicator values (metrics specific to a process) and system indicator values (metrics automatically captured).
When designing a process, developers create business indicators for data objects whose metrics they want to capture and display as X axis, Y axis, and filter values. You select the business or system indicators to plot them in charts and graphs. You must be assigned the Process Owner role, the Administrator role, or the Analytics Viewer role to create and view business analytics dashboards. See Assign and Manage Roles.
Select System Indicators
You can select the system indicators when you add filters to create business analytics charts and graphs.
The following are the valid filter values for some of the system indicator columns:
-
Is Recoverable
-
Y: Represents Yes
-
N: Represents No
-
-
All other system indicator colums starting with "Is ..."
-
0: Represents false
-
1: Represents true
-
-
Due Status
-
DUE SOON
-
MISSED DUE
-
ON TRACK
-
OVERDUE
-
-
Process Activation Status
-
-1: refers to un-activated status
-
0: refers to retired status
-
1: refers to activated status
-
-
Process Instance Status
-
ABORTED
-
ACTIVE
-
COMPLETED
-
FAULTED
-
SUSPENDED
-
-
Activity Instance Status
-
ABORTED
-
ACTIVE
-
COMPLETED
-
FAULTED
-
MOVED
-
SUSPENDED
-
-
Assignment state
-
ACQUIRED
-
ASSIGNED
-
COMPLETED
-
ERRORED
-
EXPIRED
-
DELETED
-
WITHDRAWN
-
SUSPENDED
-
-
Task State
-
ALERTED
-
ASSIGNED
-
COMPLETED
-
ERRORED
-
EXPIRED
-
DELETED
-
INFO_REQUESTED
-
WITHDRAWN
-
SUSPENDED
-

