3 Work with Stream Analytics Artifacts
Stream Analytics has various artifacts like connections, references, streams, targets, and more. Artifacts are important resources that you can use to create pipelines.
About the Catalog
The Catalog page is the location where resources including pipelines, streams, references, maps, connections, and targets are listed. This is the go-to place for you to perform any tasks in Stream Analytics.
You can mark a resource as a favorite in the Catalog by clicking on the Star icon. Click the icon again to remove it from your favorites. You can also delete a resource or view its topology using the menu icon to the right of the favorite icon.
The tags applied to items in the Catalog are also listed on the screen below the left navigation pane. You can click any of these tags to display only the items with that tag in the Catalog. The tag appears at the top of the screen. Click Clear All at the top of the screen to clear the Catalog and display all the items.
You can include or exclude pipelines, streams, references, maps, connections, and targets using the View All link in the left panel under Show Me. When you click View All, a check mark appears beside it and all the components are displayed in the Catalog.
When you want to display or view only a few or selective items in the Catalog, deselect View All and select the individual components. Only the selected components will appear in the Catalog.
Create a Stream
A stream is a source of events with a given content (shape).
To create a stream:
-
Navigate to Catalog.
-
Select Stream in the Create New Item menu.
-
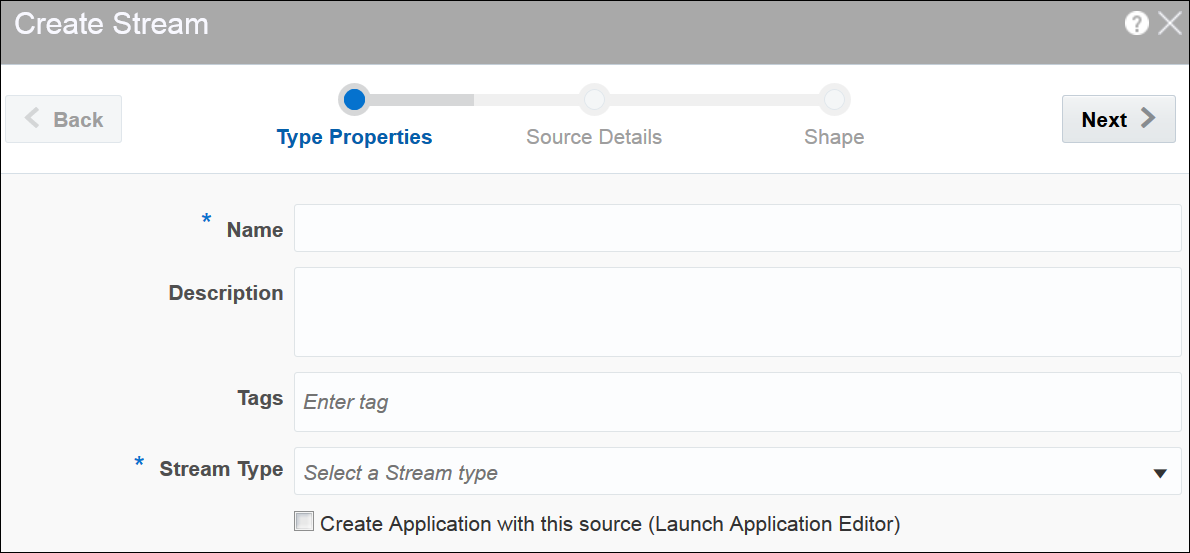
Provide details for the following fields on the Type Properties page and click Next:
-
Name — name of the stream
-
Description — description of the stream
-
Tags — tags you want to use for the stream
-
Stream Type — select suitable stream type. Supported types are Kafka and GoldenGate
-
-
Provide details for the following fields on the Source Details page and click Next:
-
Connection — the connection for the stream
-
Topic Name — the topic name that receives events you want to analyze
-
-
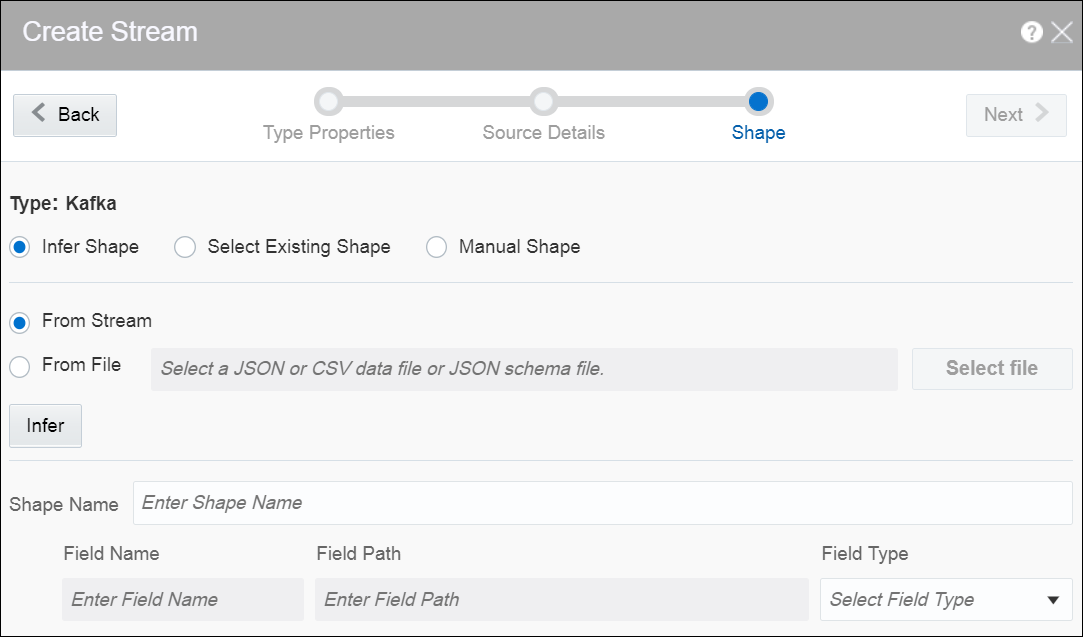
Select one of the mechanisms to define the shape on the Shape page:
-
Infer Shape
-
Select Existing Shape
-
Manual Shape
Infer Shape detects the shape automatically from the input data stream. You can infer the shape from Kafka or from JSON schema/message in a file. You can also save the auto detected shape and use it later.
Select Existing Shape lets you choose one of the existing shapes from the drop-down list.
Manual Shape populates the existing fields and also allows you to add or remove columns from the shape. You can also update the datatype of the fields.
-
A stream is created with specified details.
Create a Reference
A reference defines a read-only source of reference data to enrich a stream. A stream containing a customer name could use a reference containing customer data to add the customer’s address to the stream by doing a lookup using the customer name. A reference currently can only refer to database tables. A reference requires a database connection.
To create a reference:
-
Navigate to Catalog.
-
Select Reference in the Create New Item menu.
-
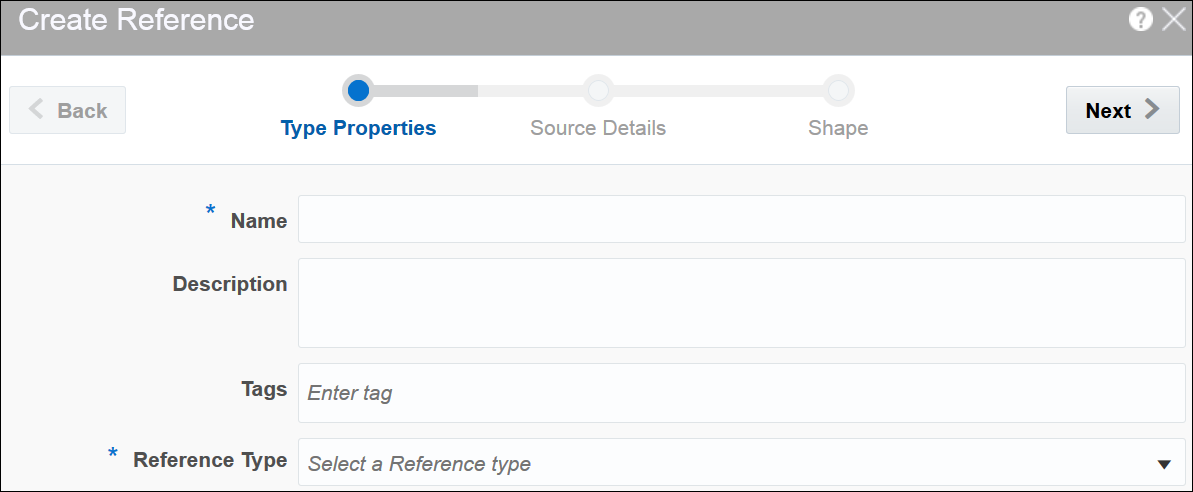
Provide details for the following fields on the Type Properties page and click Next:
-
Name — name of the reference
-
Description — description of the reference
-
Tags — tags you want to use for the reference
-
Reference Type — the reference type of the reference
-
-
Provide details for the following fields on the Source Details page and click Next:
-
Connection — the connection for the stream
-
Enable Caching — select this option to enable caching for better performance at the cost of higher memory usage of the Spark applications. Caching is supported only for single equality join condition. When you enable caching, any update to the reference table does not take effect as the data is fetched from the cache.
-
-
Provide details for the following fields on the Shape page and click Save:
-
Name — name of the database table
Remember:
Ensure that you do not use any of the CQL reserved words as the column names. If you use the reserved keywords, you cannot deploy the pipeline.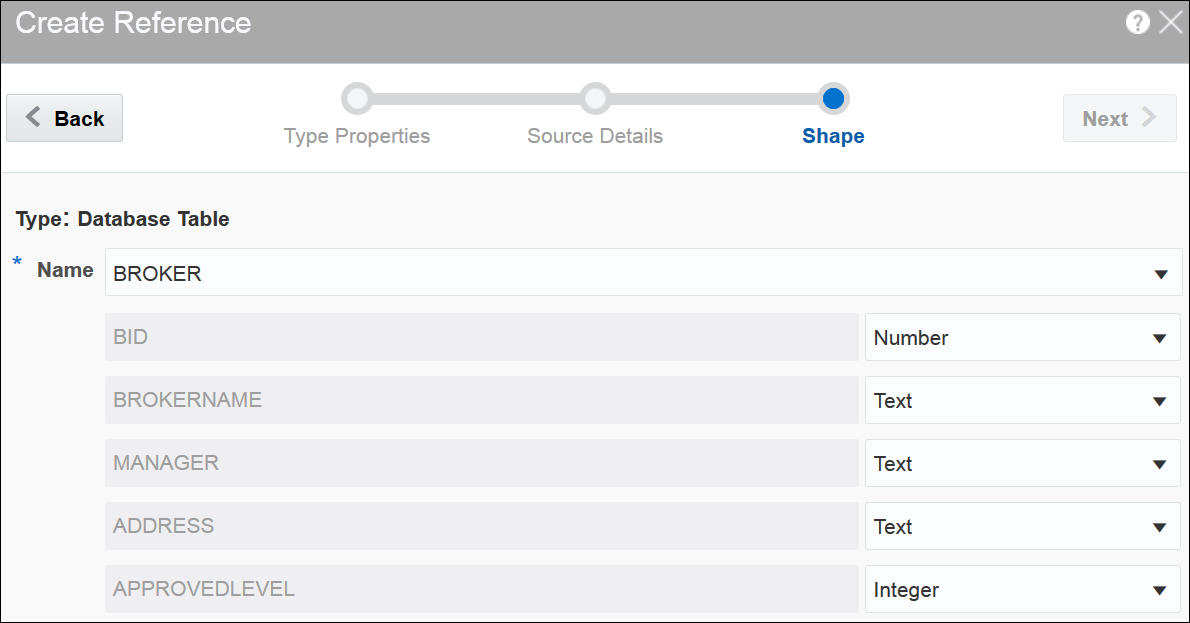
Description of the illustration create_reference_shape.png
-
When the datatype of the table data is not supported, the table columns do not have auto generated datatype. Only the following datatypes are supported:
-
numeric -
interval day to second -
text -
timestamp(without timezone) -
date time(without timezone)
A reference is created with the specified details.
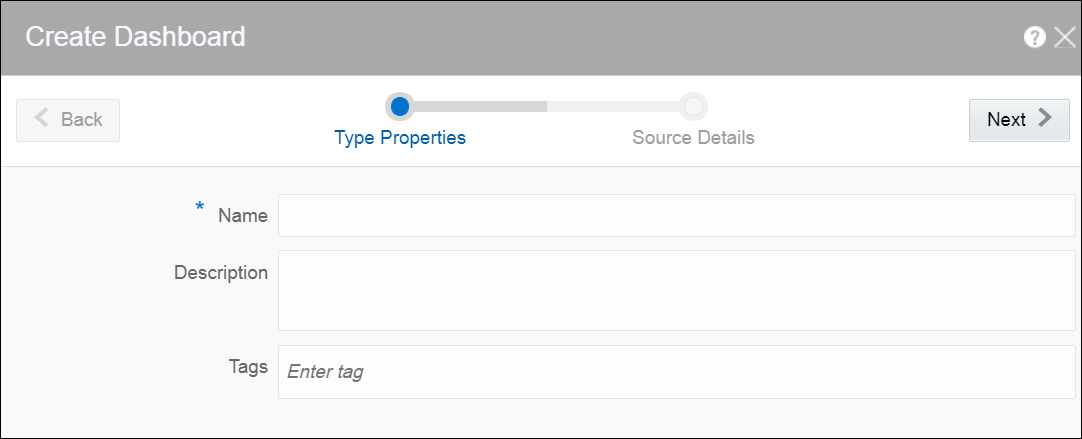
Create a Dashboard
A dashboard is a visualization tool that helps you look at and analyze the data related to a pipeline based on various metrics like slices.
A dashboard is an analytics feature. You can create dashboards in Stream Analytics to have a quick view at the metrics.
To create a dashboard:After you have created the dashboard, it is just an empty dashboard. You need to start adding details to the dashboard.
Editing a Dashboard
To edit a dashboard:
-
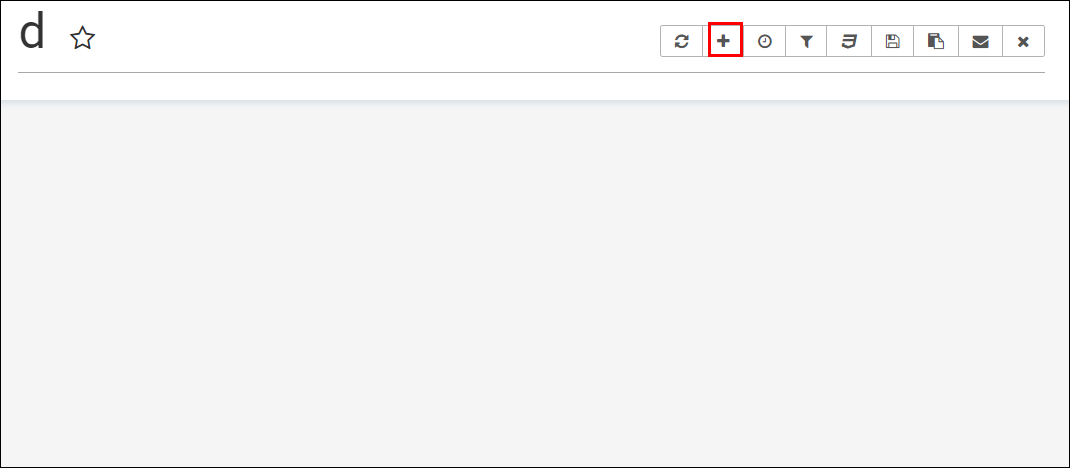
Click the required dashboard in the catalog.
The dashboard opens in the dashboard editor.
-
Click the Add a new slice to the dashboard icon to see a list of existing slices. Go through the list, select one or more slices and add them to the dashboard.
-
Click the Specify refresh interval icon to select the refresh frequency for the dashboard.
This just a client side setting and is not persisted with the Superset Version
0.17.0. -
Click the Apply CSS to the dashboard icon to select a CSS. You can also edit the CSS in the live editor.
-
Click the Save icon to save the changes you have made to the dashboard.
-
Within the added slice, click the Explore chart icon to open the chart editor of the slice.
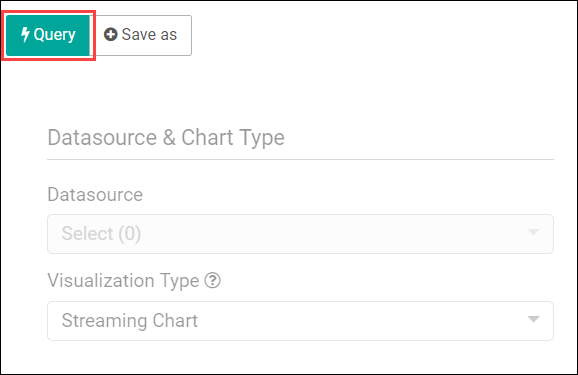
Description of the illustration explore_chart.pngYou can see the metadata of the slice.
-
Click Save as to make the following changes to the dashboard:
-
Overwrite the current slice with a different name
-
Add the slice to an existing dashboard
-
Add the slice to a new dashboard
-
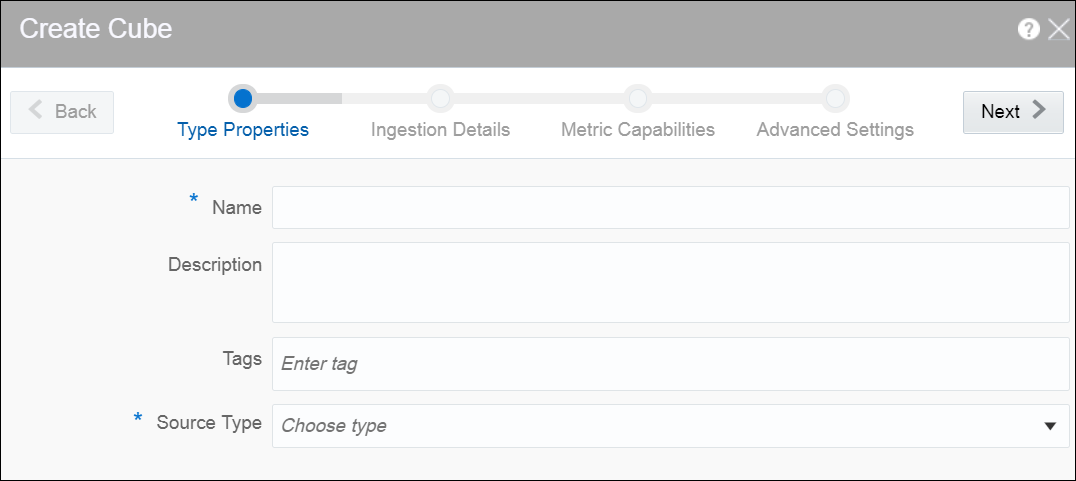
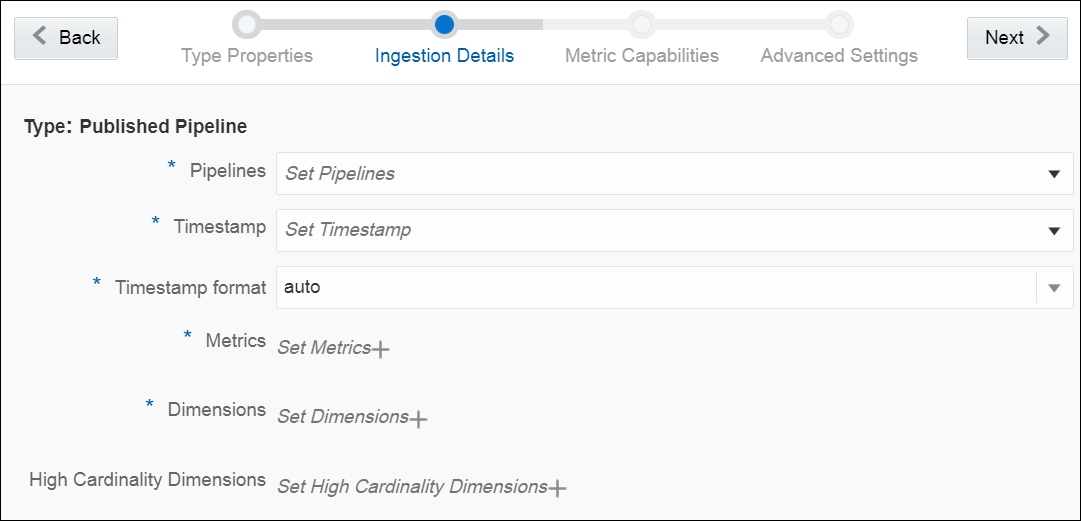
Create a Cube
A cube is a data structure that helps in quickly analyzing the data related to a business problem on multiple dimensions.
The cube feature works only when you have enabled Analytics. Verify this in System Settings.
To create a cube:
Create a Target
A target defines a destination for output data coming from a pipeline.
To create a target:
-
Navigate to Catalog.
-
Select Target in the Create New Item menu.
-
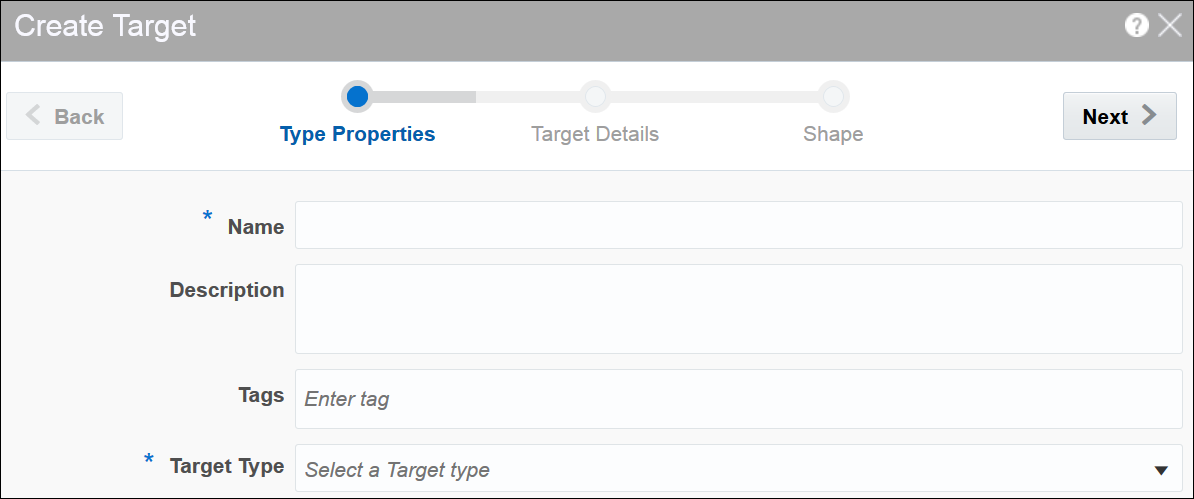
Provide details for the following fields on the Type Properties page and click Save and Next:
-
Name — name of the target
-
Description — description of the target
-
Tags — tags you want to use for the target
-
Target Type — the transport type of the target. Supported types are Kafka and REST.
-
-
Provide details for the following fields on the Target Details page and click Next:
When the target type is Kafka:
-
Connection — the connection for the target
-
Topic Name — the Kafka topic to be used in the target
When the target type is REST:
-
URL — enter the REST service URL. This is a mandatory field.
-
Custom HTTP headers — set the custom headers for HTTP. This is an optional field.
-
Batch processing — select this option to send events in batches and not one by one. Enable this option for high throughput pipelines. This is an optional field.
Click Test connection to check if the connection has been established successfully.
Testing REST targets is a heuristic process. It uses proxy settings. The testing process uses GET request to ping the given URL and returns success if the server returns
OK (status code 200). The return content is of the type ofapplication/json. -
-
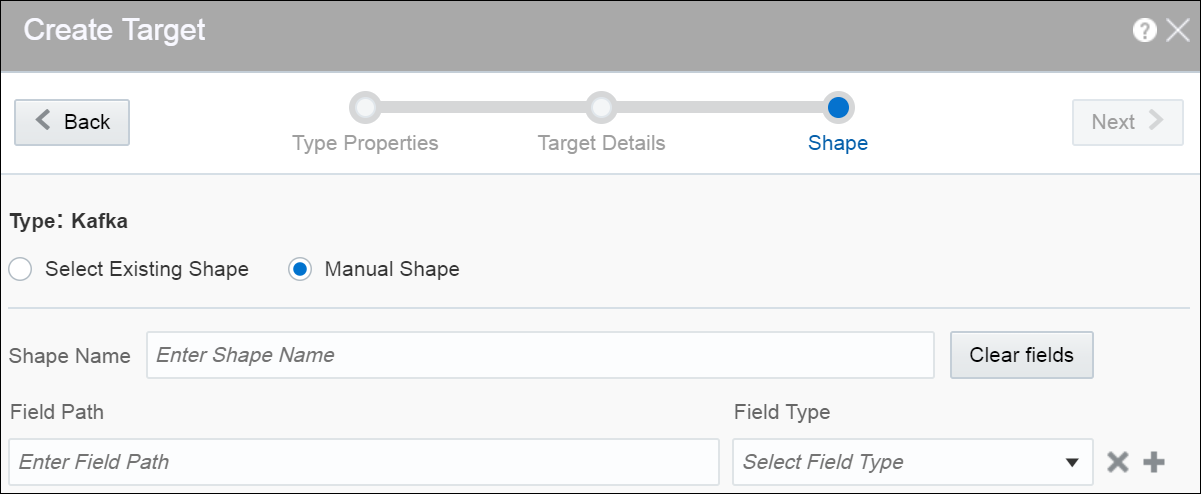
Select one of the mechanisms to define the shape on the Shape page and click Save:
-
Select Existing Shape lets you choose one of the existing shapes from the drop-down list.
-
Manual Shape populates the existing fields and also allows you to add or remove columns from the shape. You can also update the datatype of the fields.
-
A target is created with specified details.
Creating Target from Pipeline Editor
Alternatively, you can also create a target from the pipeline editor. When you click Create in the target stage, you are navigated to the Create Target dialog box. Provide all the required details and complete the target creation process. When you create a target from the pipeline editor, the shape gets pre-populated with the shape from the last stage.
Create a Geo Fence
Geo fences are further classified into two categories: manual geo fence and database-based geo fence.
Create a Manual Geo Fence
To create a manual geo fence:
-
Navigate to the Catalog page.
-
Click Create New Item and select Geo Fence from the drop-down list.
The Create Geo Fence dialog opens.
-
Enter a suitable name for the Geo Fence.
-
Select Manually Created Geo Fence as the Type.
-
Click Save.
The Geo Fence Editor opens. In this editor you can create the geo fence according to your requirement.
-
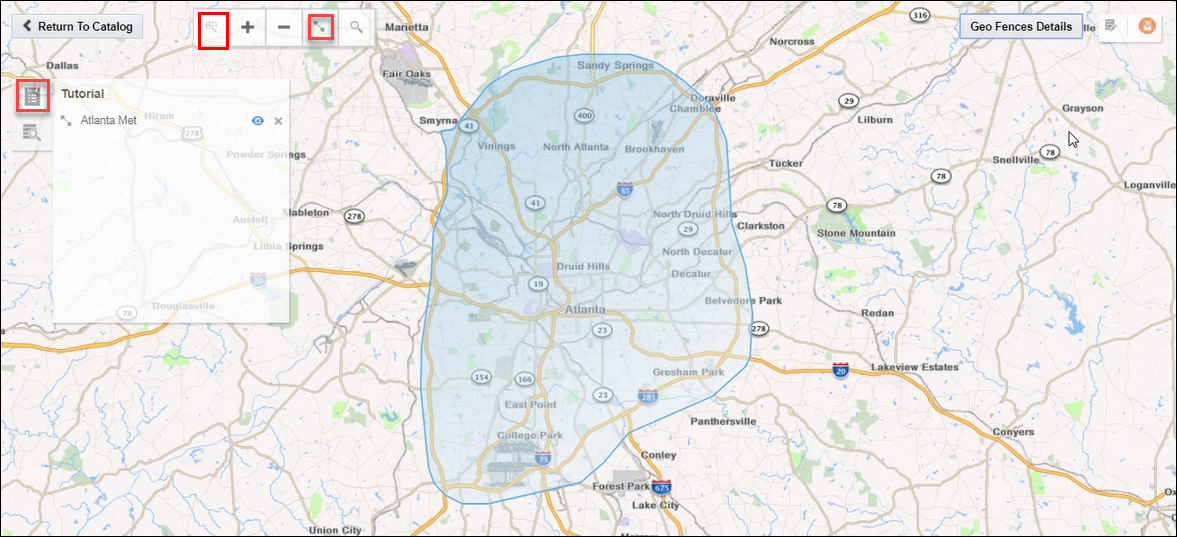
Within the Geo Fence Editor, Zoom In or Zoom Out to navigate to the required area using the zoom icons in the toolbar located on the top-left side of the screen.
You can also use the Marquee Zoom tool to move across locations on the map.
-
Click the Polygon Tool and mark the area around a region to create a geo fence.
-
Enter a name and description, and click Save to save your changes.
Update a Manual Geo Fence
To update a manual geo fence:
-
Navigate to the Catalog page.
-
Click the name of the geo fence you want to update.
The Geo Fence Editor opens. You can edit/update the geo fence here.
Search Within a Manual Geo Fence
You can search the geo fence based on the country and a region or address. The search field allows you search within the available list of countries. When you click the search results tile in the left center of the geo fence and select any result, you are automatically zoomed in to that specific area.
Delete a Manual Geo Fence
To delete a manual geo fence:
-
Navigate to Catalog page.
-
Click Actions, then select Delete Item to delete the selected geo fence.
Create a Database-based Geo Fence
To create a database-based geo fence:
-
Navigate to Catalog page.
-
Click Create New Item and then select Geo Fence from the drop-down list.
The Create Geo Fence dialog opens.
-
Enter a suitable name for the geo fence.
-
Select Geo Fence from Database as the Type.
-
Click Next and select Connection.
-
Click Next.
All tables that have the field type as
SDO_GEOMETERYappear in the drop-down list. -
Select the required table to define the shape.
-
Click Save.
Note:
You cannot edit/update database-based geo fences.Delete a Database-based Geo Fence
To delete a database-based geo fence:
-
Navigate to Catalog page.
-
Click Actions and then select Delete Item to delete the selected geo fence.
Create a Pipeline
A pipeline is a Spark application where you implement your business logic. It can have multiple stages such as a query, a pattern stage, a business rule, or a query group.
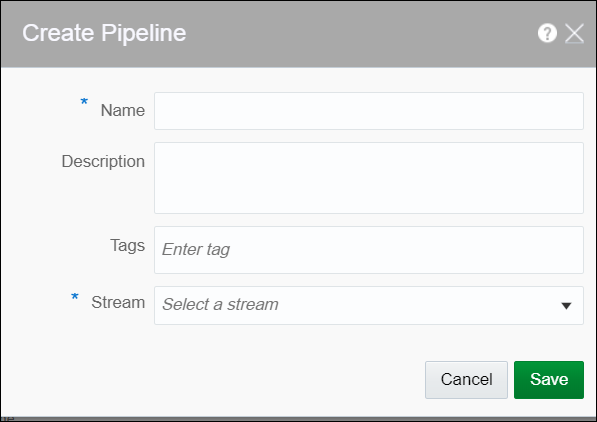
To create a pipeline:
-
Navigate to Catalog.
-
Select Pipeline in the Create New Item menu.
-
Provide details for the following fields and click Save:
-
Name — name of the pipeline
-
Description — description of the pipeline
-
Tags — tags you want to use for the pipeline
-
Stream — the stream you want to use for the pipeline
-
A pipeline is created with specified details.
Configure a Pipeline
You can configure a pipeline to use various stages like query, pattern, rules, query group.
Add a Query Stage
You can include simple or complex queries on the data stream without any coding to obtain refined results in the output.
- Open a pipeline in the Pipeline Editor.
- Click the Add a Stage button and select Query.
- Enter a Name and Description for the Query Stage.
- Click Save.
Adding and Correlating Sources and References
You can correlate sources and references in a pipeline.
Adding Filters
You can add filters in a pipeline to obtain more accurate streaming data.
Adding Summaries
- Open a pipeline in the Pipeline Editor.
- Select the required query stage and click the Summaries tab.
- Click Add a Summary.
- Select the suitable function and the required column.
- Repeat the above steps to add as many summaries you want.
Adding Group Bys
When you create a group by, the live output table shows the group by column alone by default. Turn ON Retain All Columns to display all columns in the output table.
You can add multiple group bys as well.
Adding Visualizations
Visualizations are graphical representation of the streaming data in a pipeline. You can add visualizations on all stages in the pipeline.
Updating Visualizations
You can perform update operations like edit and delete on the visualizations after you add them.
You can open the visualization in a new window/tab using the Maximize Visualizations icon in the visualization canvas.
Edit Visualization
To edit a visualization:
-
On the stage that has visualizations, click the Visualizations tab.
-
Identify the visualization that you want to edit and click the pencil icon next to the visualization name.
-
In the Edit Visualization dialog box that appears, make the changes you want. You can even change the Y Axis and X Axis selections. When you change the Y Axis and X Axis values, you will notice a difference in the visualization as the basis on which the graph is plotted has changed.
Change Orientation
Based on the data that you have in the visualization or your requirement, you can change the orientation of the visualization. You can toggle between horizontal and vertical orientations by clicking the Flip Chart Layout icon in the visualization canvas.
Delete Visualization
You can delete the visualization if you no longer need it in the pipeline. In the visualization canvas, click the Delete icon to delete the visualization from the pipeline. Be careful while you delete the visualization, as it is deleted with immediate effect and there is no way to restore it once deleted.
Working with a Live Output Table
The streaming data in the pipeline appears in a live output table.
Hide/Unhide Columns
In the live output table, right-click columns and click Hide to hide that column from the output. To unhide the hidden columns, click Columns and then click the eye icon to make the columns visible in the output.
Select/Unselect the Columns
Click the Columns link at the top of the output table to view all the columns available. Use the arrow icons to either select or unselect individual columns or all columns. Only columns you select appear in the output table.
Pause/Restart the Table
Click Pause/Resume to pause or resume the streaming data in the output table.
Perform Operations on Column Headers
Right-click on any column header to perform the following operations:
-
Hide — hides the column from the output table. Click the Columns link and unhide the hidden columns.
-
Remove from output — removes the column from the output table. Click the Columns link and select the columns to be included in the output table.
-
Rename — renames the column to the specified name.
-
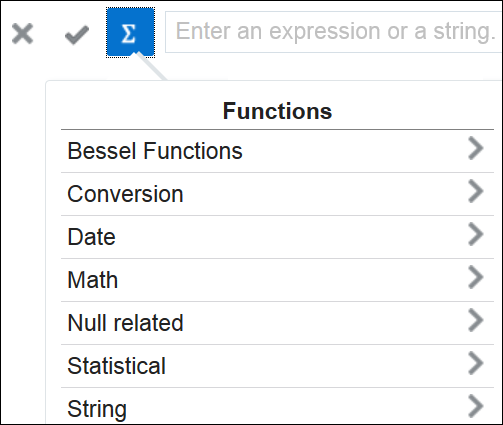
Function — captures the column in Expression Builder using which you can perform various operations through the in-built functions.
Add a Timestamp
Include timestamp in the live output table by clicking the clock icon in the output table.
Reorder the Columns
Click and drag the column headers to right or left in the output table to reorder the columns.
Using the Expression Builder
You can perform calculations on the data streaming in the pipeline using in-built functions of the Expression Builder.
Stream Analytics supports various functions. For a list of supported functions, see Expression Builder Functions.
Adding a Constant Value Column
A constant value is a simple string or number. No calculation is performed on a constant value. Enter a constant value directly in the expression builder to add it to the live output table.
Using Functions
You can select a CQL Function from the list of available functions and select the input parameters. Make sure to begin the expression with =”. Click Apply to apply the function to the streaming data.
Add a Pattern Stage
Patterns are templatized stages. You supply a few parameters for the template and a stage is generated based on the template.
Add a Rule Stage
Using a rule stage, you can add IF-THEN logic to your pipeline. A rule is a set of conditions and actions applied to a stream.
- Open a pipeline in the Pipeline Editor.
- Click Add a Stage.
- Select Rules.
- Enter a Name and Description for the rule stage.
- Click Add a Rule.
- Enter Rule Name and Description for the rule and click Done to save the rule.
- Select a suitable condition in the IF statement, THEN statement, and click Add Action to add actions within the business rules.
Add a Query Group Stage
A query group stage allows you to use more than one query group to process your data - a stream or a table in memory. A query group is a combination of summaries (aggregation functions), GROUP BYs, filters and a range window. Different query groups process your input in parallel and the results are combined in the query group stage output. You can also define input filters that process the incoming stream before the query group logic is applied, and result filters that are applied on the combined output of all query groups together.
A query group stage of the stream type applies processing logic to a stream. It is in essence similar to several parallel query stages grouped together for the sake of simplicity.
A query group stage of the table type can be added to a stream containing transactional semantic, such as a change data capture stream produced, to give just one example, by the Oracle Golden Gate Big Data plugin. The stage of this type will recreate the original database table in memory using the transactional semantics contained in the stream. You can then apply query groups to this table in memory to run real-time analytics on your transactional data without affecting the performance of your database.
Configure a Target
A target defines a destination for output data coming from a pipeline.
- Open a pipeline in the Pipeline Editor.
- Click Target in the left tree.
- Select a target for the pipeline from the drop-down list.
- Map each of the Target Property and Output Stream Property.
You can also directly create the target from within the pipeline editor. See Create a Target for the procedure. You can also edit an existing target.
The pipeline is configured with the specified target.Publish a Pipeline
You must publish a pipeline to make the pipeline available for all users of Stream Analytics and send data to targets.
A published pipeline will continue to run on your Spark cluster after you exit the Pipeline Editor, unlike the draft pipelines, which are undeployed to release resources.
To publish a pipeline:
Use the Topology Viewer
Topology is a graphical representation and illustration of the connected entities and the dependencies between the artifacts.
The topology viewer helps you in identifying the dependencies that a selected entity has on other entities. Understanding the dependencies helps you in being cautious while deleting or undeploying an entity. Stream Analytics supports two contexts for the topology — Immediate Family and Extended Family.
You can launch the Topology viewer in any of the following ways:
-
Select Show topology from the Catalog Actions menu to launch the Topology Viewer for the selected entity.

Description of the illustration show_topology_catalog_actions_menu.png -
Click the Show Topology icon in the Pipeline Editor.

Description of the illustration show_topology_exploration_editor.png
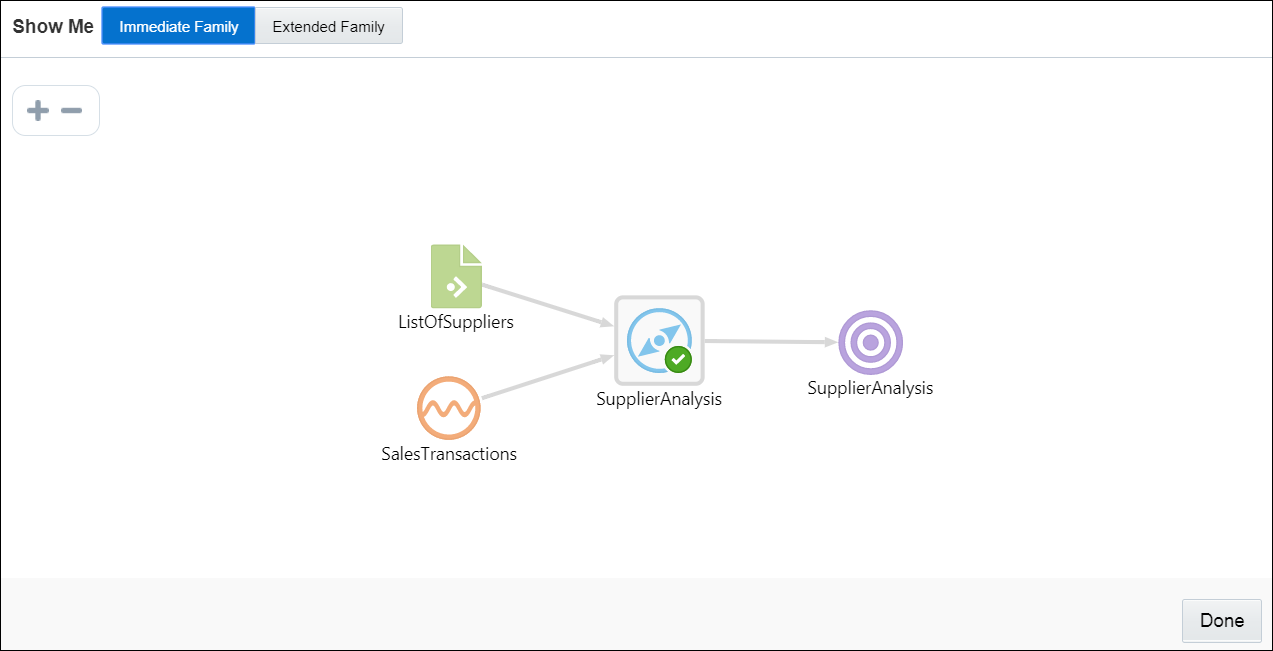
Click the Show Topology icon at the top-right corner of the editor to open the topology viewer.By default, the topology of the entity from which you launch the Topology Viewer is displayed. The context of this topology is Immediate Family, which indicates that only the immediate dependencies and connections between the entity and other entities are shown. You can switch the context of the topology to display the full topology of the entity from which you have launched the Topology Viewer. The topology in an Extended Family context displays all the dependencies and connections in the topology in a hierarchical manner.
Note:
The entity for which the topology is shown has a grey box surrounding it in the Topology Viewer.Immediate Family
Immediate Family context displays the dependencies between the selected entity and its child or parent.
The following figure illustrates how a topology looks in the Immediate Family.
Description of the illustration topology_viewer_immediate.png
Extended Family
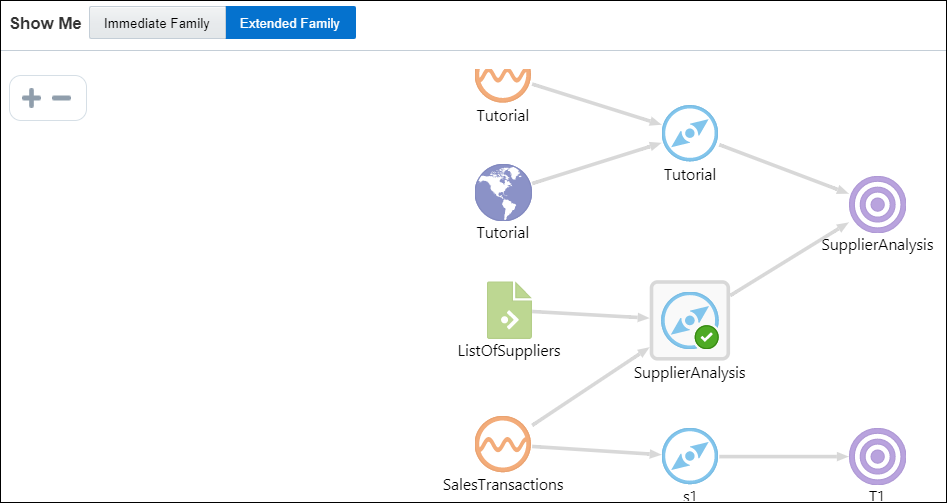
Extended Family context displays the dependencies between the entities in a full context, that is if an entity has a child entity and a parent entity, and the parent entity has other dependencies, all the dependencies are shown in the Full context.
The following figure illustrates how a topology looks in the Extended Family.
