Viewing Metrics on the Metrics Page
The Metrics page is a view-only page that shows storage, application, and data source statistics for a service instance.
-
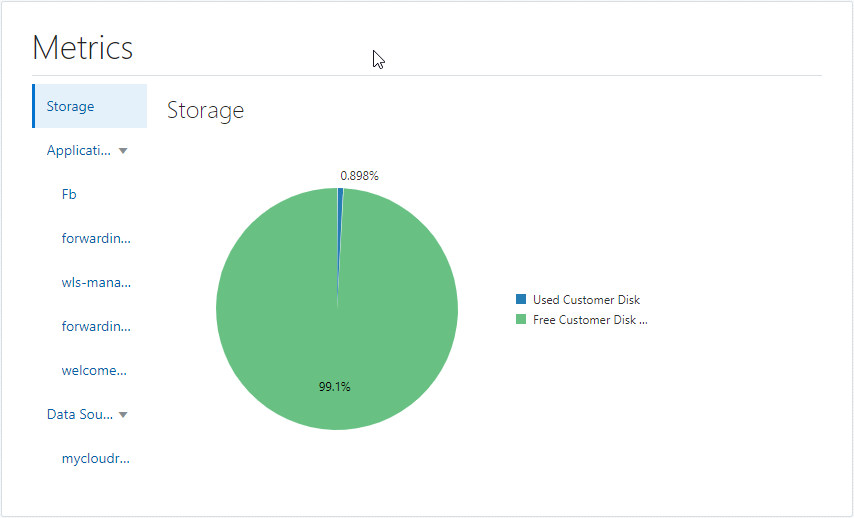
Storage; select Storage to see a pie chart depicting how the service instance is using customer disk storage (as shown in the preceding example).
-
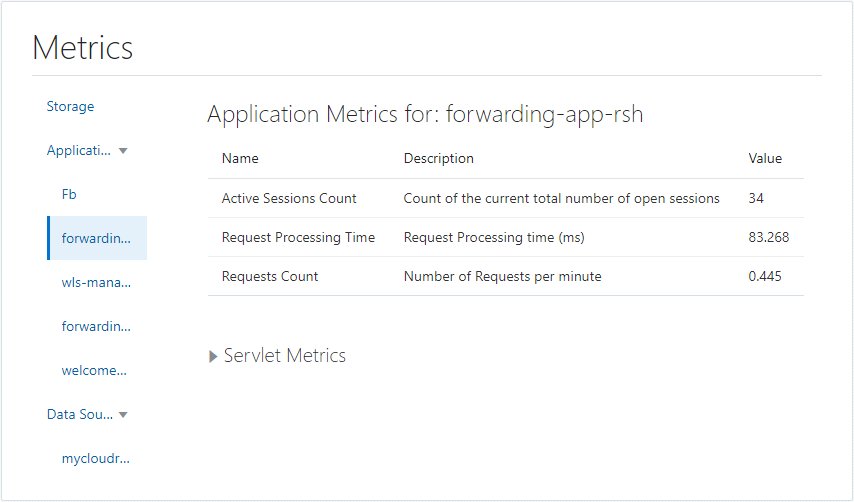
Applications; select Applications to open a list of all applications used by the service instance. Next, select the desired application. A table appears containing the name, description, and value that application.
Data presented is:-
Active Sessions Count; that is, the number of current active sessions.
-
Request Processing Time; that is, the average amount of time it takes a request to process.
-
Request Count; that is, the number of requests.
-
-
Data Source Metrics; select Data Sources to open a list of all data sources used by the service instance. Next, select the desired data source. A table appears containing the name, description, and value for the data source:
-
Open JDBC Connections Count; that is, the current number of open JDBC connections.
-
Connections Total Count; that is, the current total number of connections, both open and closed.
-
JDBC Connection Create Count; that is, numberof JDBC connections created.
-


