Proactively Monitor the User Experience
You can use the Oracle Management Cloud environment to monitor the user experience on Oracle E-Business Suite. The out-of-the-box dashboards provide an integrated view of the system health, and can be a good place to start your analysis.
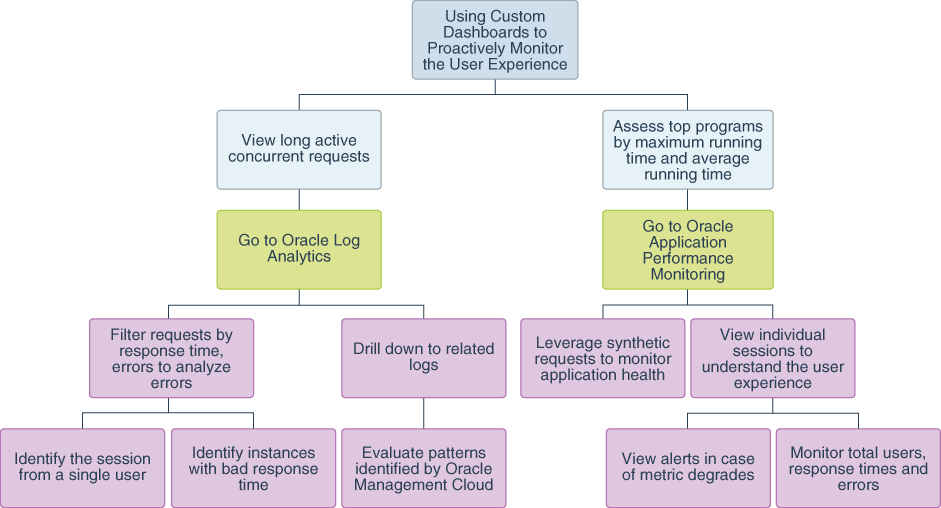
The workflow to monitor the user experience:
The following are some of the suggestive methods to pursue the use case:
-
Understand the user experience by exploring the individual user sessions:
-
Monitor the total number of users, response times, and errors encountered.
-
Receive alerts when any of the Oracle E-Business Suite metrics degrade. You can automate remediation action that must be performed in response to the alert.
-
-
Leverage synthetic requests to monitor application health:
-
Test wide range of pages, transactions, and jobs.
-
Test from different environment options to assess response time.
-
Baseline the response time to obtain interesting analytical results.
-
-
Set up proactive alerts for user response time and transaction completion times.
-
Filter requests by useful parameters such as response time and errors:
-
Identify specific instances with bad response time.
-
Identify the session from a single user to understand the system behavior.
-
-
Analyze the delay using Oracle Log Analytics:
-
After you identify the entities that are reporting delayed response or error, drill down to the related logs.
-
Use the analytical capabilities of Oracle Management Cloud to identify problems patterns.
-
-
Use Oracle Management Cloud error tool tips to mitigate the error.
