Clusters Visualization
Clustering uses machine learning to identify the pattern of log records, and then to group the logs that have a similar pattern.
You can generate alerts for the cluster utilities like potential issues and outliers by using the link by clusters feature. See Generate Alerts for Cluster Utilities.
- Search for logs for a set of entities. See Search Logs by Entities.
- From the Visualize panel, select Cluster (
 ).
).
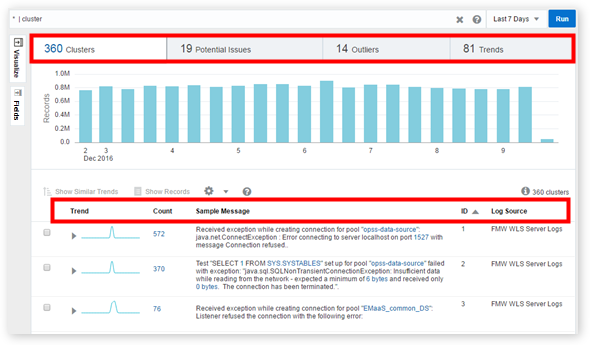
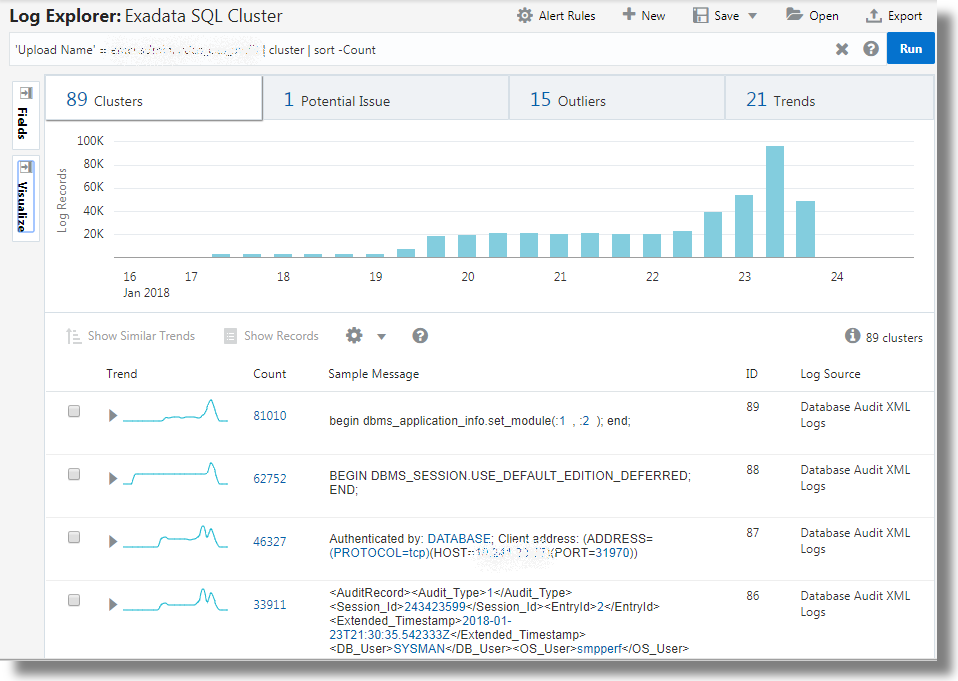
The Cluster view displays a summary banner at the top showing the following tabs:
-
Total Clusters: Total number of clusters for the selected log records.
-
Potential Issues: Number of clusters that have potential issues based on log records containing words such as error, fatal, exception, and so on.
-
Outliers: Number of clusters that have occurred only once during a given time period.
-
Trends: Number of unique trends during the time period. Many clusters may have the same trend. So, clicking this panel shows a cluster from each of the trends.
Note:
If you hover your cursor over this panel, then you can also see the number of log records (for example, 22 clusters from 1,200 log records).
When you click any of the tabs, the histogram view of the cluster changes to display the records for the selected tab.
Each cluster pattern displays the following:
-
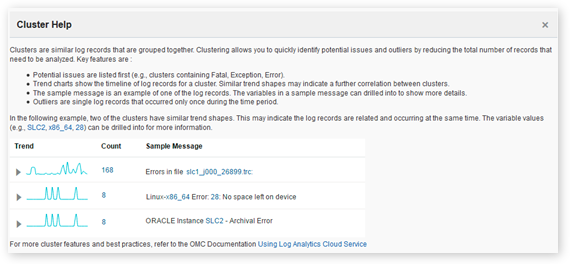
Trend: This column displays a sparkline representation of the trend (called trend shape) of the generation of log messages (of a cluster) based on the time range that you selected when you clustered the records. Each trend shape is identified by a Shape ID such as 1, 2, 3, and so on. This helps you to sort the clustered records on the basis of trend shapes.
Clicking the arrow to the left of a trend entry displays the time series visualization of the cluster results. This visualization shows how the log records in a cluster were spread out based on the time range that was selected in the query. The trend shape is a sparkline representation of the time series.
-
ID: This column lists the cluster ID. The ID is unique within the collection.
-
Count: This column lists the number of log records having the same message signature.
-
Sample Message: This column displays a sample log record from the message signature.
-
Log Source: This column lists the log sources that generated the messages of the cluster.
You can click Show Similar Trends to sort clusters in an ascending order of trend shapes. You can also select a cluster ID or multiple cluster IDs and click Show Records to display all the records for the selected IDs.
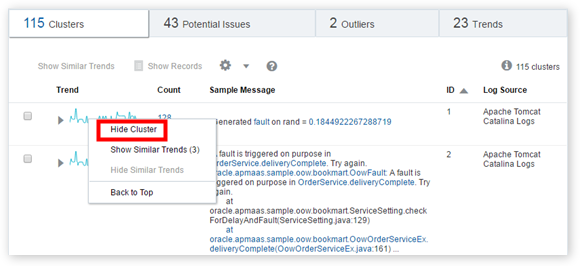
You can also hide a cluster message or multiple clusters from the cluster results if the output seems cluttered. Right-click the required cluster and select Hide Cluster.
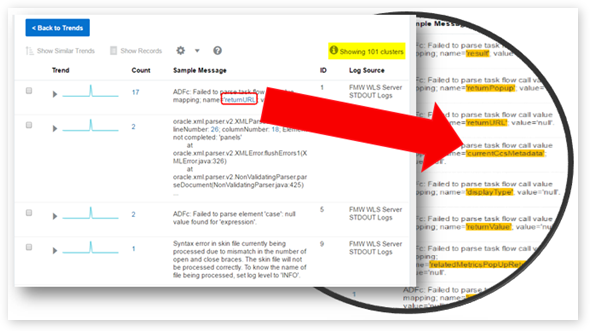
In each record, the variable values are highlighted. You can view all the similar variables in each cluster by clicking a variable in the Sample Message section. Clicking the variables shows all the values (in the entire record set) for that particular variable.
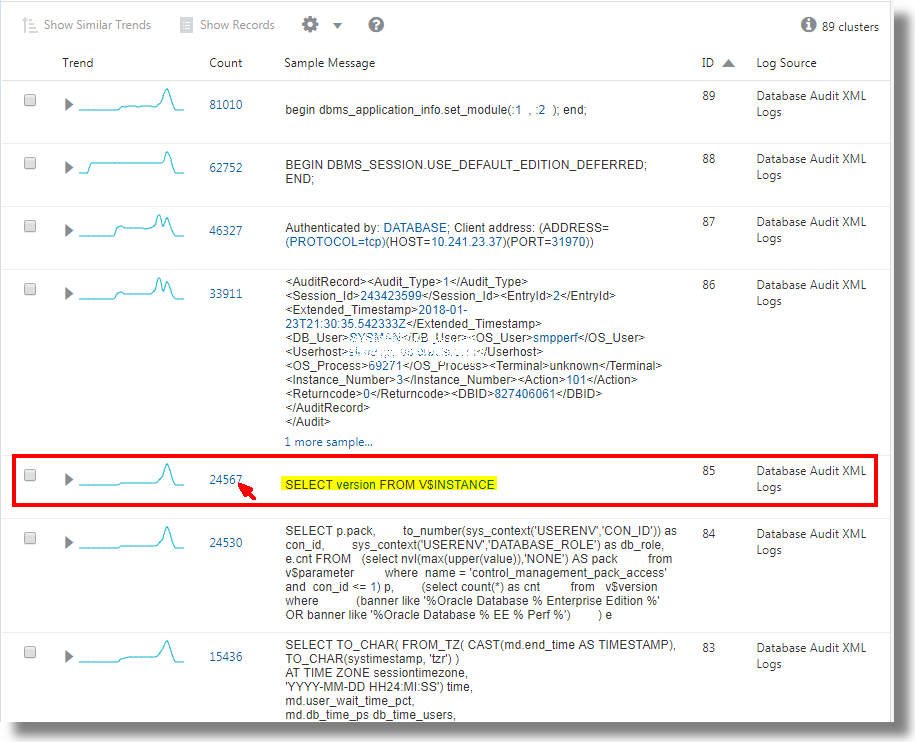
In the Sample Message section, some cluster patterns display a <n> more samples... link. Clicking this link displays more clusters that look similar to the selected cluster pattern.
Clicking Back to Trends takes you back to the previous page with context (it scrolls back to where you selected the variable to drill down further). The browser back button also takes you back to the previous page; however, the context won’t be maintained, because the cluster command is executed again in that case.
Cluster the Log Data Using SQL Fields
The large volume of log records are reduced to 89 clusters, thus offering you fewer groups of log data to analyze.
You can drill down the clusters by selecting the variables. For example, from the above set of clusters, select the cluster that has the sample message SELECT version FROM V$INSTANCE:
This displays the histogram visualization of the log records containing the specified sample message. You can now analyze the original log content. Click Back to Cluster to return to the cluster visualization.
The Trends panel shows the SQLs that have similar execution pattern.
The Outliers panel displays the SQLs that are rare and different.
Use Cluster Compare Utility
The cluster compare utility can be used to identify new issues by comparing the current set of clusters to a baseline and reducing the results by eliminating common or duplicate clusters. Some of the typical scenarios are:
- What clusters are different in this week compared to last week?
- What's the difference between the cluster set of entity A and the set of entity B?
- Things were working well in the month X. What changed in this month?
Given two sets of log data, the cluster compare utility removes the data pertaining to the common clusters, and displays histogram data and the records table that are unique to each set. For example, when you compare the log data from week x and week y, the clusters that are common to both the weeks are removed for simplification, and the data unique to each week is displayed. This enables you to identify patterns that are unique for the specific week, and analyze the behavior.
For the syntax and other details of the clustercompare command, see Clustercompare Command in Using Oracle Log Analytics Search.
- In clusters
 visualization, select your current time range. By default, the query is
 *. You can refine the query to filter the log data. - In the Visualize panel, click Cluster Compare.
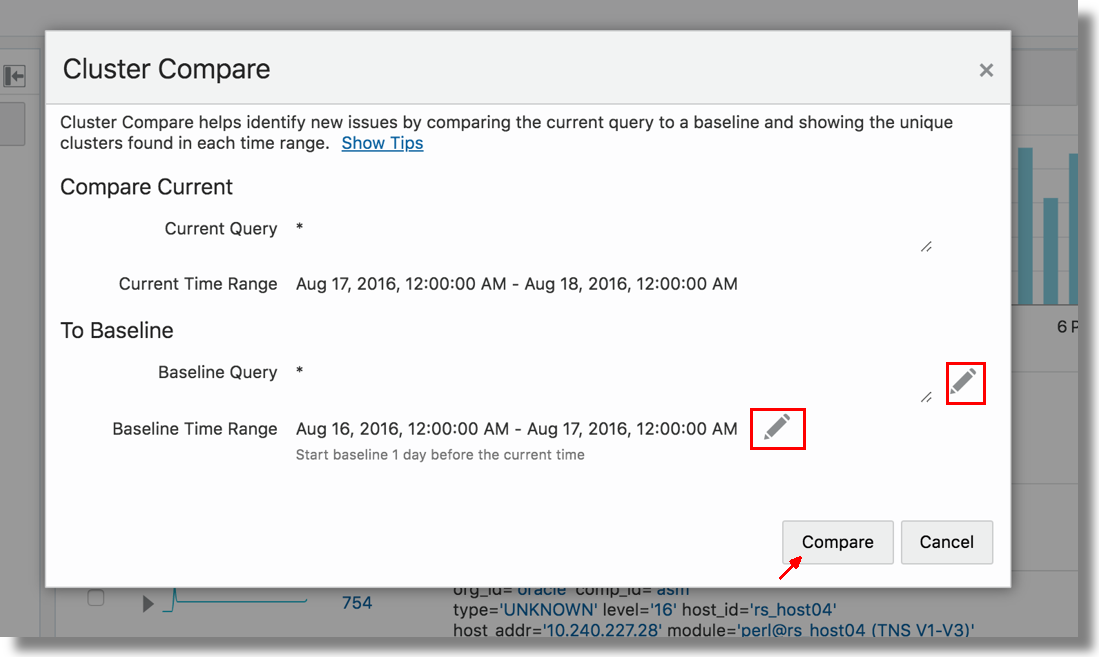
The cluster compare dialog box opens.
- You can notice that the current query and the current time range are displayed for reference.
- Baseline Query: By default, this is the same as your current query. Click the
 and modify the baseline query, if required.
- Baseline Time Range: By default, the cluster compare utility uses the Use Time Shift option to determine the baseline time range. Hence, the baseline time range is of the same duration as the current time range and is shifted to the period before the current time range. You can modify this by clicking the
 icon and selecting Use Custom Time or Use Current Time. If you select Use Custom Time, then specify the custom time range using the menu.
- Click Compare.
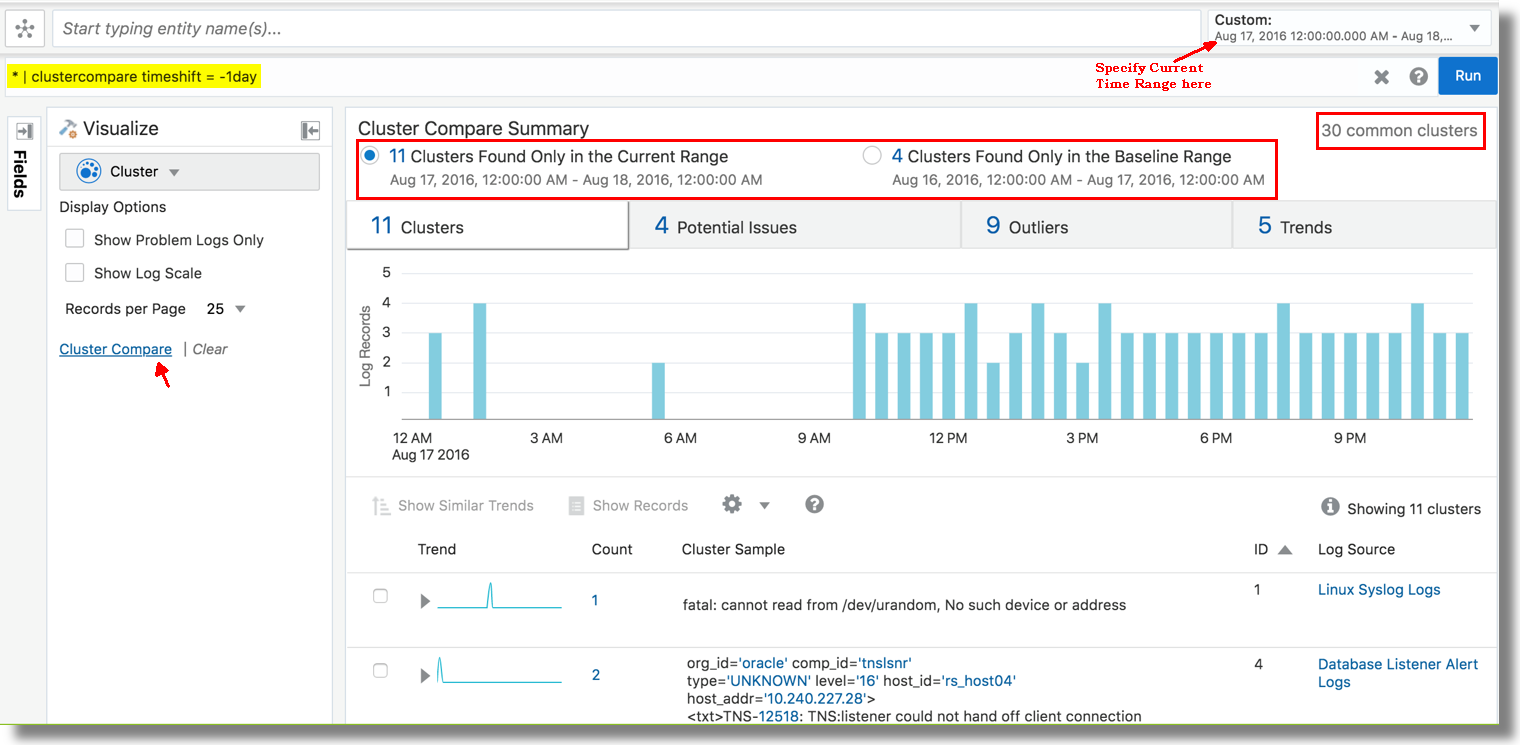
You can now view the cluster comparison between the two log sets.
Click the button corresponding to each set to view the details like clusters, potential issues, outliers, trends, and records table that are unique to the set. The page also displays the number of clusters that are common between the two log sets.
In the above example, there are 11 clusters found only in the current range, 4 clusters found only in the baseline range, and 30 clusters common in both the ranges. The histogram for the current time range displays the visualization using only the log data that is unique to the current time range.
- Baseline Query: By default, this is the same as your current query. Click the
Note:
Clusters found only in the current range are returned first, followed by clusters found only in the baseline range. The combined results are limited to 500 clusters. To reduce the cluster compare results, reduce the current time range or append a command to limit the number of results. For example, append | head 250 will limit both current and baseline clusters to 250 each. Use multi-select (click and drag hold) on the cluster histogram to reduce the current time range when using the custom time option. The time range shift value may be converted to minutes or seconds to ensure no time gaps or overlaps occur between the current and baseline time ranges.
Use Dictionary Lookup in Cluster
Use dictionary lookup after the cluster command to annotate
clusters.
Consider the cluster results for Fusion Middleware WebLogic
Server Logs. To define a dictionary to add labels based on the Cluster
Sample field:
-
Create a CSV file with the following contents:
Operator,Condition,Issue,Area
CONTAINS REGEX,[Mm]alformed request .null.\.\s+Request parsing failed,Parsing Error,Request Processing
CONTAINS,Failed to associate the transaction context with the response while marshalling,Marshalling Error,Response
CONTAINS,A RuntimeException was generated by the RMI server,Exception,RMI
CONTAINS,unable to establish JMX Connectivity,Connection Error,JMX
CONTAINS REGEX,Can not locate \S+ for now. DMS will,DMS Search Error,DMS
Import this as a Dictionary type lookup using the name WLS Error Categories. This lookup contains two fields, Issue and Area that can be returned on a matching condition. See Create a Dictionary Lookup.
-
Use the dictionary in cluster to return a field:
Run the
clustercommand for the FMW WLS Server Logs. Add alookupcommand aftercluster, as shown below:'Log Source' = 'FMW WLS Server Logs' | cluster | lookup table = 'WLS Error Categories' select Issue using 'Cluster Sample'The value of Cluster Sample for each row is evaluated against the rules defined in the WLS Error Categories dictionary. The Issue field is returned from each matching row.
-
Return more than one field by selecting each field in the
lookupcommand:'Log Source' = 'FMW WLS Server Logs' | cluster | lookup table = 'WLS Error Categories' select Issue as Category, Area using 'Cluster Sample'The above query selects the Issue field, and also renames it to Category. Area field is also selected, but not renamed.
-
Filter the cluster results using the dictionary fields:
Use the
wherecommand on the specific fields to filter the clusters. Consider the following query:'Log Source' = 'FMW WLS Server Logs' | cluster | lookup table = 'WLS Error Categories' select Issue as Category, Area using 'Cluster Sample' | where Area in (RMI, Messaging)This displays only those records that matches the specified values for Area field.
