View the Field Summary
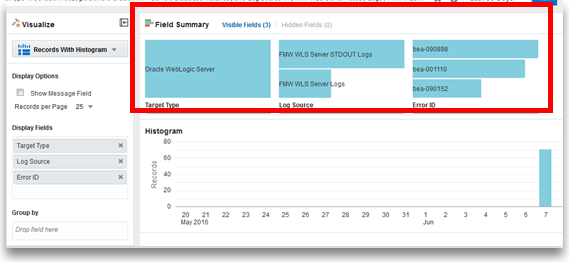
When using any variation of the Histogram visualization, Oracle Log Analytics provides a high-level summary of the key fields of the log entries that are returned as search results. The field summary, which is represented in the form of horizontal bar charts, presents a quicker way to analyze your search results, by grouping the entries based on the display fields that you’ve selected.
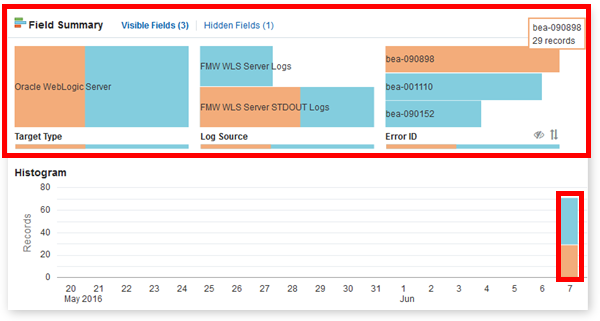
For example, in your search query, you’ve selected Oracle WebLogic Server as the entity type, FMW WLS Server logs as the log source, and bea-090898, bea-001110, and bea-090152 as error IDs. You’ve also selected Entity Type, Log Source, and Error ID as display fields. Then, the field summary displays a snapshot of the search results grouped by the display fields. If you hover your cursor over a particular error ID in the Field Summary section, then Oracle Log Analytics highlights the error ID and also highlights the relevant portions of the horizontal bar charts of all the associated entity types and log sources that are displayed in the summary. In addition, the relevant portion in the Histogram visualization is also highlighted, depicting the number of records that are associated with the selected error ID.
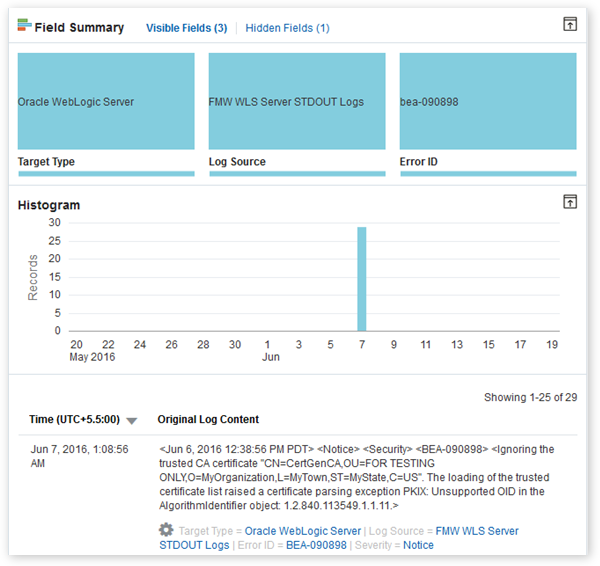
If you click the selected error ID, then the field summary, histogram, and the table of records change to return only those entity types, log sources, and records that contain the selected error ID. You can add as many fields as you want in the summary by dragging and dropping attributes from the Fields panel.
To view the field summary:
In the prior example, if you hover your cursor over an error ID, such as bea-090898, then Log Analytics highlights the error ID in the Error ID field of the Field Summary section. It also highlights the relevant portions of the horizontal bar charts of all the entity types and log sources associated with bea-090898, which are displayed in the summary. In addition, the relevant portion in the Histogram visualization is also highlighted, depicting the number of records that are associated with bea-090898.
If you click bea-090898 in the Error ID field of the summary results in the field summary, histogram and the table of records change to return only those entity types, log sources, and records that contain bea-090898.


