8 Monitor the Availability and Performance of Your Infrastructure
Monitoring your entities’ health and performance is an important part of every IT administrator’s job. Oracle Infrastructure Monitoring allows you to setup alerts, investigate alerts and monitor the availability status and performance of your infrastructure.
Typical Workflow for Monitoring the Availability and Performance of Your Infrastructure
Table 8-1 Workflow to Monitor the Availability and Performance of Your Infrastructure
| Task | Description | More Information |
|---|---|---|
|
Find out if any entities are down across the enterprise. |
Identify and investigate entities that are down or have availability issues. |
|
|
Investigate open alerts. |
Review details of each open alert. |
|
|
Look for entities that are down within the tier that you manage. |
Within each tier, investigate entities that are down or have availability issues. |
|
|
Identify and analyze performance issues within the tier that you manage. |
Within each tier, identify entities that have potential performance problems. |
|
|
Check the overall health of an entity. |
Check current performance of an entity. |
Monitor Availability Status
As an administrator responsible for your entire IT infrastructure, you constantly monitor the availability status of all your infrastructure components so that you can detect and resolve problems before they affect users. Oracle Infrastructure Monitoring provides an Entity Summary Dashboard that shows at a glance the current availability of all your monitored entities.
Availability Status Monitoring
-
Availability status is monitored automatically
-
If an entity is down, a Down alert of fatal severity is automatically generated. If it is a host or agent entity, a not heard from alert (also fatal severity) is generated.
-
To get notifications for these, you must create an alert rule, choose the entity type (or entity) and choose Availability alert condition.
-
Once an entity is detected to be up, the alert will clear automatically.
-
If there is an error with evaluating availability status, the entity is in Error status. An alert will be generated automatically for this as well.
To monitor the current availability status across your IT infrastructure:
-
Navigate to the Enterprise Summary page and locate the Status region to view the current availability status all your entities. Note the date and time on the top-right corner of the page and make sure that you have a refreshed set of data. Set the page Auto Refresh option to a value that best matches the period during which your data needs to be refreshed.
The Entities Status section indicates the state of each entity:
-
UpThe entity is up and running, metrics are correctly collected. -
ErrorThe entity has encountered some errors, and it needs further investigation. -
DownThe entity is down, it isn’t in a running state. -
PendingThe entity is in the process of being added to the monitoring service.
-
-
Typically, you first focus on entities that show a
DownorErrorstatus.Drill down into theDownorErrorlabels and note all the entities with this status. To narrow down your list you can:- Filter your list of entities by type.
- Search for a particular entity by name . For example, if you have selected entities with
Downstatus, you can check one of the entity types listed on the left menu, and then search for a particular entity name to further refine your list.
-
If global properties are set, further filter your list by the global properties of your entities. For example, you might choose to look first into Production systems and later into any non-production systems.
-
For every system with a
DownorErrorstatus, drill down into the Entity Home page for more details. Review in particular any availability alert messages on the Alerts section of the home page. Alert messages provide critical information that helps resolve availability problems. When an issue is resolved, the alert automatically clears.
To set up alert rules to send notifications for entities down or other availability issues, see Set Up Alert Thresholds and Notifications.
Note:
You must have administrator privileges to create any alert rules.Host-Agent Communication Monitoring
When a gateway agent cannot reach OMC, a not heard from alert is created for the gateway. The following alert message is generated when this occurs:
OMC has not received data from <gateway name> (Gateway Agent) for <N> minutes. It could be down or there could be network issues that impact uploading of data. This impacts sending status for all associated agents and its hosts, and symptom alerts for these will not be generated.
OMC will NOT generate not heard from alerts from the agents (and associated hosts) where the agents are communicating with OMC through the impacted gateway.
If the gateway is up later on, but the agent is still down, not heard from alerts will be generated on the agent and host.
Investigate Alerts
Alerts help keep your entities continuously up and running by notifying you when performance or availability problems occur.
Alerts are generated either:
-
Automatically, for all availability issues (when an entity is down or an agent is unavailable). No alert rule is required to generate these alerts.
-
Based on custom alert rules that specify a condition. For more information, see Set Up Alert Rules.
Alerts indicate that a problem has occurred with one of your monitored entities. The alert details give you enough context to start investigating the problem. These details include the following:
-
Name and type of entity on which the alert was raised
-
Entity Status
-
Severity of the problem
-
Date and time when the alert was created as well as date and time of any other changes in the alert
-
The alert rule associated with the alert which has details about the alert condition that triggered the alert and where the notification was sent
-
Fatal: An entity is down.
-
Critical: A metric crosses a critical threshold.
-
Warning: A metric crosses a warning threshold.
-
Agent Unavailable: no recent communication has occurred between the Cloud Agent and Oracle Management Cloud. This could indicate one of the following:
-
The Cloud Agent is down.
-
Even though the Cloud Agent is running, there’s a connectivity problem between the Cloud Agent and Oracle Management Cloud.
-
The Host on which the Cloud Agent is deployed is down.
-
The Alert Details also includes a graphical display of values of the metric being tracked and its values at various points in time. The Alert History keeps track of all stages of notifications.
Investigating Alerts Received
If your Oracle Infrastructure Monitoring service was set up for receiving alerts, then your administrators on duty will receive email alerts when set thresholds are exceeded or when monitored entities are down.
If your service is not yet set up for receiving alerts, see Set Up Alert Rules. You must have Administrative privileges to perform this task.
Once you are setup to receive alerts, this is a typical workflow of investigating alerts that you receive:
-
Review the alert email and note the entity name, type, severity, and time the alert occurred. You can drill down to the alerts details directly from the email notification.
-
Click the entity name to go to its home page. Locate the alert in the Alerts region and click the alert message. A popup window will open, showing you the details of the alert.
You can further scroll back in recent history to find out the metric’s values over time. These values should provide an indication of the problem.
-
Resolve the alert.
Based on your findings, make the changes required to your monitored entity and ensure that these changes won’t affect other systems. When the issue is resolved, the alert will automatically clear.
Proactive Review of Alerts
Infrastructure administrators may also want to review on a daily basis the alerts triggered in the last 24 hours.
Here is a typical workflow of investigating alerts summarized on your service dashboards:
-
On the Enterprise Summary page, locate the Alerts region. The combination of up and down arrows and a number indicates an increase or decrease in alerts. If there is an increase, then drill down into that number to access the alerts page.

The Alerts are shown for a specified time period (global context). In addition to the total number of alerts in that time period, the alerts are further broken down into New alerts that have been raised during the period, Preexisting alerts that were present at the start of the time period, as well as the number of alerts that are Still Open (broken down by severity).
-
Investigate each newly triggered alert on the Alerts page
.
For any of these cases, if you determine that the alert was triggered prematurely, then consider adjusting the alerts thresholds, see Set Up Alert Rules .
Note:
You must have administrator privileges to edit alert rules.Related Alerts
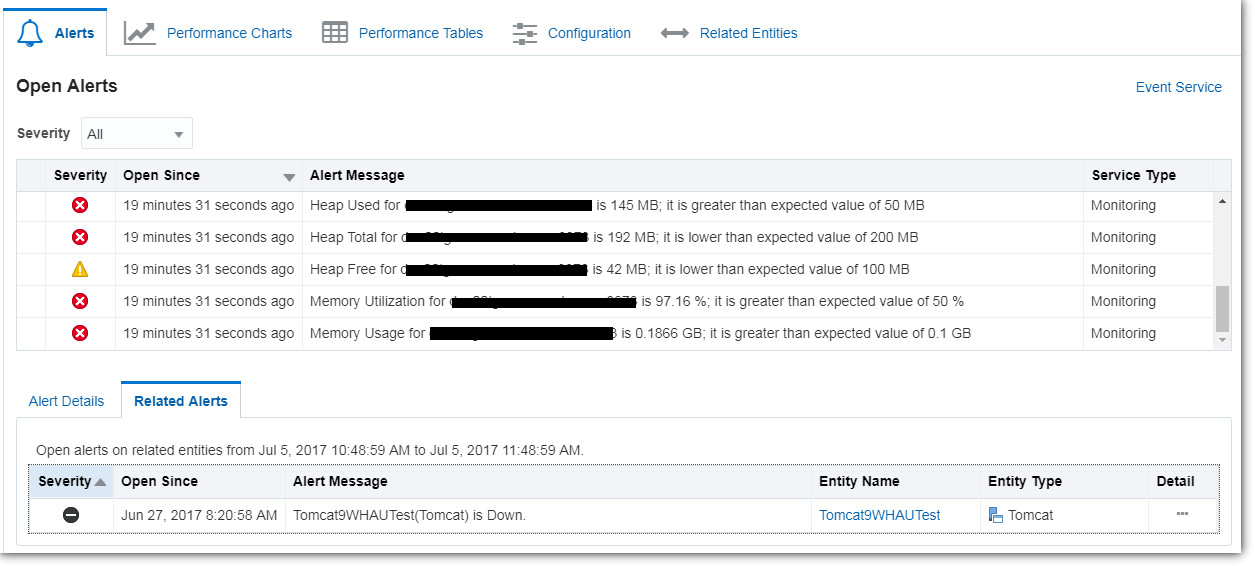
Alerts for an entity can be triggered by alerts occurring on related entities. For example, a Linux host may have a WebLogic server, a Tomcat server, and multiple Oracle databases. Because these servers and databases are related to the host, alerts occurring on them can affect the alert status of the host itself. Specifically, related alerts are alerts that occur on related entities and that have been triggered within a 30 minute time frame (30 minutes before and 30 minutes after) the original alert.
To help you diagnose these types of related entity alert issues, you can view related alerts directly from an entity’s home page.
-
Navigate to an entity home page.
-
From the Alerts tab, select an individual alert. The Alert Details and Related Alerts tabs display.
-
Click on the Related Alerts tab as shown in the following graphic.
“Not Heard From” Alerts on Agent and Host
-
The host is monitored by the agent that is deployed on the host.
-
Host availability is based on agent availability. Agent availability is based on Oracle Management Cloud receiving its performance data in regular intervals.
If there is no data received for some time, then:
-
Agent and host are put in "Not Heard From" status and "Not Heard From" alerts of fatal severity are generated for the agent and host.
-
To get notifications for these, create an alert rule, choose host and/or agent entities, choose availability condition and specify notification channels.
-
Once the agent is back up (i.e. Oracle Management Cloud starts receiving data from the agent), then the agent and host are returned to Up status and the Not Heard From alert clears.
Monitor Availability Status Within Each Tier
For administrators responsible for various tiers of the IT infrastructure, the Oracle Infrastructure Monitoring Service Enterprise Summary dashboard provides tier regions that indicate the current status and performance of all entities in that particular tier.
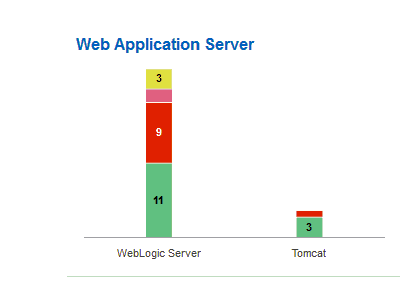
The tiered status bar charts show the breakdown of status for each entity type monitored in your enterprise within that tier. For example, the following bar chart shows status of the Web Application Servers.
Of the total number of WebLogic Servers:
-
11 are Up (running as expected)
-
9 are Down
-
2 have Errors (more investigation needed)
-
3 are in Pending status (in the process of becoming actively monitored)
Of the total number of Tomcat servers:
-
3 are Up (running as expected)
-
1 is Down
Here are some examples of tasks to perform within a tier you’re investigating:
-
Drill down into entities with a status other than Up.
-
Identify entities related to those that don’t have an Up status. For example, locate the hosts that host the Web Application Servers with a Down status.
-
Review the home page for each entity that you determined is having a problem. Look for alerts and key performance metrics. Wherever applicable, entities are automatically associated and grouped as related entities. For example, application servers will automatically be associated with their corresponding database. Entities association can be viewed from the Topology display at the top of each page.
Monitor Performance Within Each Tier
For administrators responsible for various infrastructure tiers, the Enterprise Summary page provides tier regions that allow you to monitor the current performance of all entities within that tier.
The top of the Enterprise Summary page displays rolled-up information that applies to all entities: the total number of entities, the breakdown of entities status and a break-down of all alerts triggered for all entities. Below this, the graphical interface groups the entities by tiers and rolls-up status and performance information for each tier. Entities not part of any specific tier are categorized under the “Others” section. Wherever applicable, entities are automatically associated and grouped as related entities. For example, application servers will automatically be associated with their corresponding database. Entities association can be viewed from the Topology display at the top of each page.
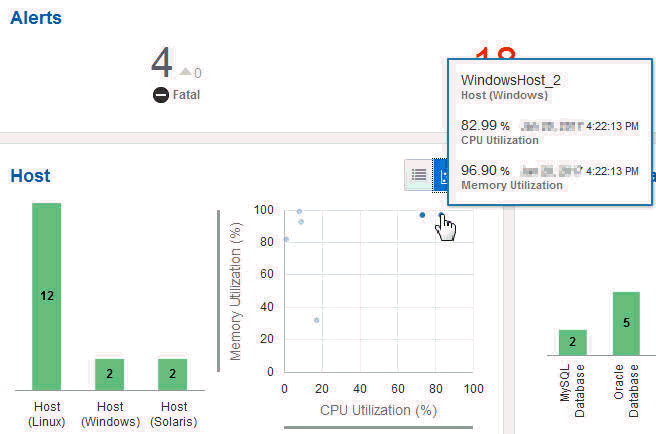
Navigate to the Enterprise Summary page and locate the performance metrics charts for the tier you are interested in. Note first the status of all entities in your tier. Then, on the performance charts look for outliers (points on the charts that look different and are isolated compared to the others). Hover over these points to see the entity name and metric values at that point.
For example, on the CPU Load vs CPU Utilization chart, one of the points looks like an outlier. Both the CPU Utilization and Memory Utilization are high. This will require more investigation
-
Click the points on the chart to display a full history of those metrics and see if there is a trend in the metric values.
-
Change the metrics displayed in the scatter chart to review the collective performance of any other two metrics. To vary the metrics displayed on each chart, select Choose Metrics.
-
Check for outliers in this chart, look for high values of CPU Utilization % and/or Memory Utilization % which could indicate that these hosts are currently under a heavy load.
-
Hover your mouse over the data point to find out which specific host is under heavy load.
-
Click the data point to examine the trend of these metrics and identify how long the hosts have been under a heavy load. A long trend might indicate issues on the host that need further investigation.
While exploring your tiers, it is useful to see a sorted list of values of a particular metric, for the tier you are investigating. To help you visually assess the relative performance across entities in a tier, you can switch the display from a scatter chart to a metric table listing the top values (or bottom values) of a particular metric for all entities. This data helps to assess the most heavily loaded entities or those with the slowest performance within a tier. To correlate your findings with other related metrics, click the Edit button to select a new metric and assess its values for the subset of entities you are interested in.
Additional Performance Charts Controls
On the Performance charts, use the scroll wheel on the mouse to zoom in and out while maintaining the same center of the image.
You can hold down your left mouse button to select an area of data to zoom in on. When you release the mouse button, the selected area will pan to the center of the screen and automatically zoom in to fill the entire area of the chart.
The x-axis and y-axis ranges can also slide. Hold down the left mouse button and move left and right on the x-axis, or up and down on the y-axis, until you find the ideal concentration of points for your research.
Monitor Entity Health
By proactively monitoring your infrastructure, you can identify and resolve potential problems before they affect users.
-
Investigating a performance problem visible on the Enterprise Summary page performance scatter charts: Drilling down into the data point of interest allows you to reach a filtered view of the metrics in question and provides a link to the associated Entity Home page.
- Troubleshooting entities status from the Enterprise Summary page Entity Status region: Clicking any status provides you with a narrowed down list of all entities with that status; you can further filter your list and click the entity name to reach that Entity Home page.
- Reviewing the health and status of any entity group from the Enterprise Summary page tiered view bar charts: Clicking any tier provides you with a narrowed down list of all entities of that type; you can further filter your list and click on the entity name to reach that Entity Home page.
- Exploring all entities from the Enterprise Summary page Entities region: Drilling down into the number of entities in your infrastructure allows you to reach the Entities page where you can further filter your list and reach a particular Entity Home page.
Exploring the Entity Home page
Here is a typical set of tasks that you can perform from the Entity Home page:-
To reach the Entity Home page, click the name of each entity you’re analyzing.
The Entity Home page has all the entity information that allows you to determine the cause of a problem. Note the following content:
-
The current availability status displaying the entity’s availability over time. Moving your cursor along the availability time line displays the corresponding time in the key performance metric charts for the entity. .
-
The open alerts in the current time period along with their status. You can drill down on the alert numbers for more detail about those alerts.
-
Key performance metrics for the entity. Clicking on a key performance metric displays detailed performance charts for that metric.
-
The Alerts tab displays all alerts for the entity. You can click on an alert to view explicit details and also view related alerts (alerts generated by related entities that impact the currently viewed entity).
-
-
Correlate your findings by identifying first when the entity status changed. Note the key performance metric values at that same time. Data from the last 24 hours is shown by default, and you can scroll back to more recent time periods to review the trend of the metrics over time. Hold down the left mouse button and slide the date range along the timeline until you reach the range with the data of interest. The first set of performance charts includes the key health indicators, but you can hover over any data point. You can also correlate the key performance metrics over the same time period, in all the functional categories mentioned (Capacity, Load, Response, Error, or Utilization) .
For example, you detect a performance degradation on one of your hosts. Note the key metric values at the same time.
Expanded Time Periods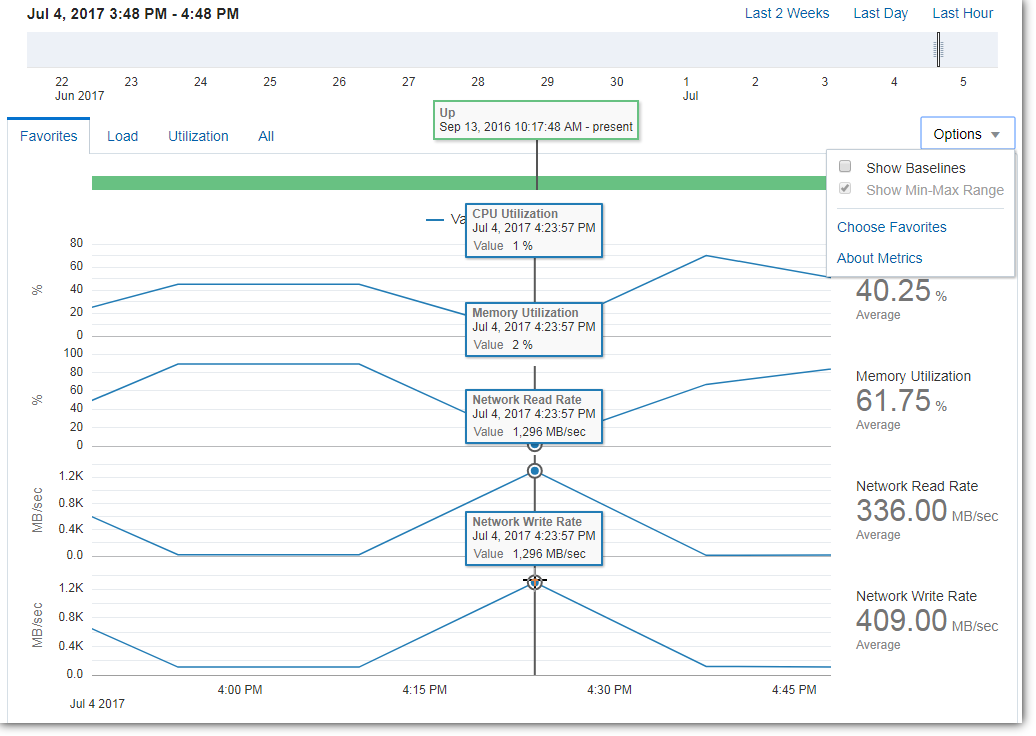
In this release, Infrastructure Monitoring pages now enable you to view status and performance data up to the Last 30 Days. This is an enhancement over prior releases where you could view status and performance only up to the last 14 days. In the entity homepages, while you can set the Global Time Period up to the Last 30 days, in order to view performance data at its finest resolution (i.e. natively collected resolution), you’ll need to set the Chart Time Slider window to at most 8 days wide.
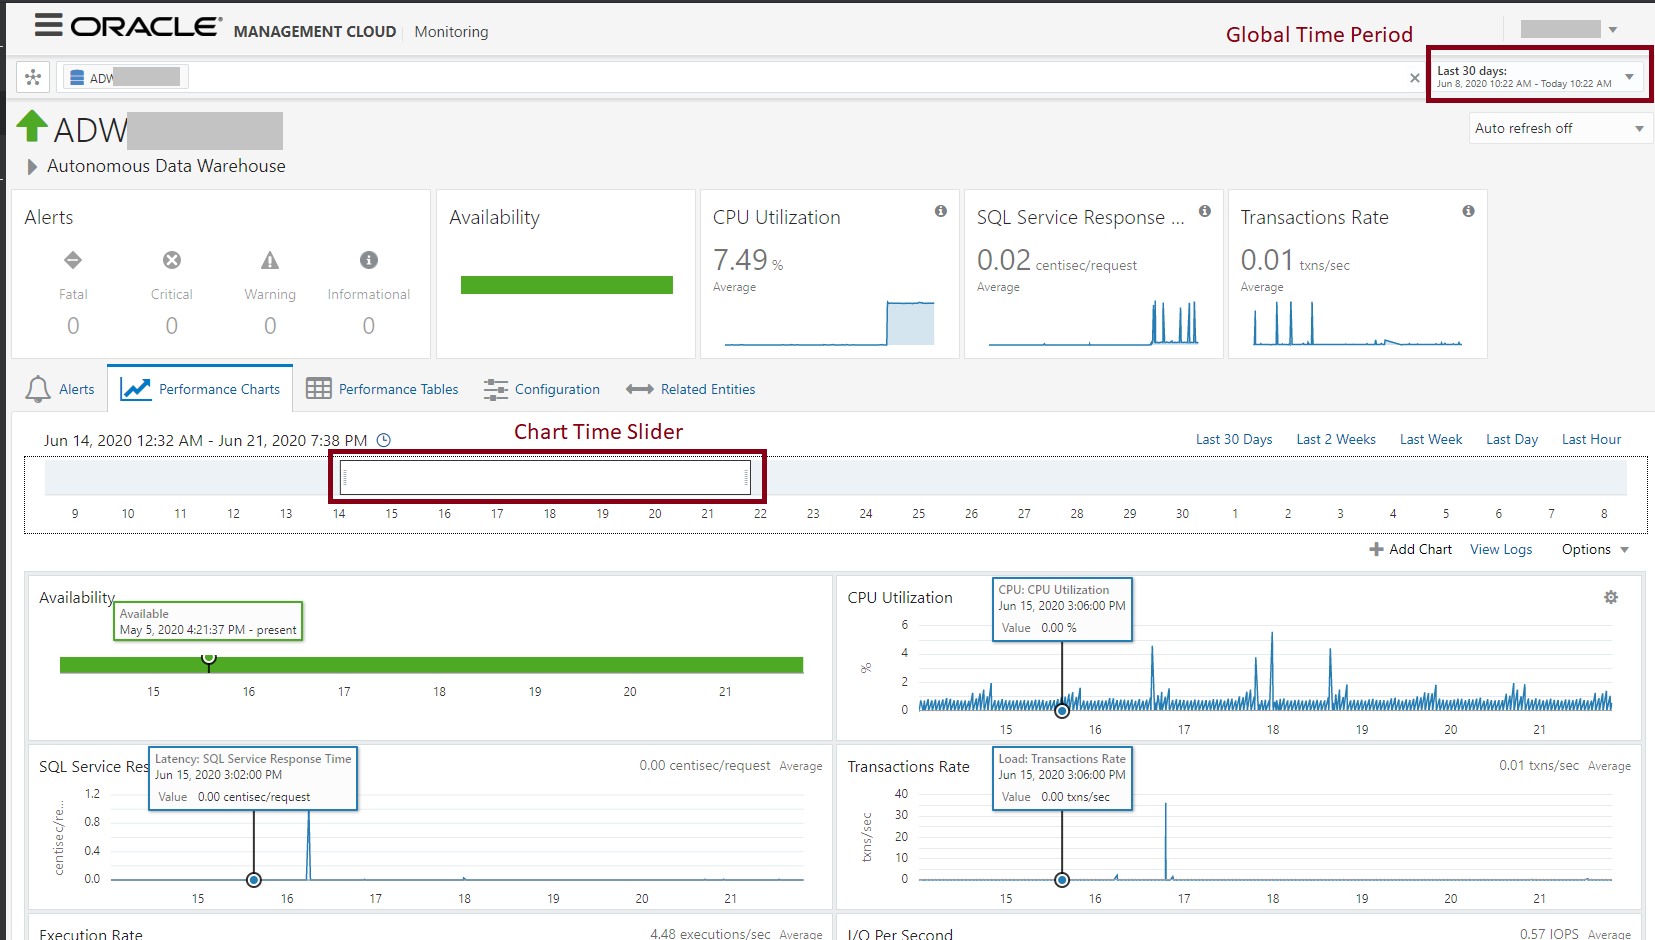
The Chart Time Slider determines the set of data points shown in the performance charts. You can move the Slider to focus on any time period within the range specified by the Global Time Period. When the Last 30 days is chosen as the Global Time period, as long as you keep the Chart Time Slider window to show at most 8 days, you can continue to view performance data at its finest resolution up to the last 30 days. This enables you to perform better diagnostics and investigation of issues across different performance metrics.
When the Chart Time Slider window is expanded to more than 8 days, then charts will automatically switch to show the hourly rollup data. This level of control enables you to view fine-grained data when doing diagnostics or view rollup data in order to understand the trends of data across longer periods of time.
-
On the performance charts, you can also select metrics to be displayed for predefined ranges, such as: Last 2 weeks, Last Day, or Last Hour. Use these preset ranges for ease of navigation. Some entities, such as relational databases, have all their properties and associated data filtered by tabs, such as: Alert, Performance Charts, Performance Tables, Configuration, and Related Entities.
Time Periods
To narrow in on a specific aspect of a monitored entity, you may only be interested in seeing a subset of metrics for that entity. For example, you have an Oracle database and you only want to see transaction volume and transaction rate displayed. You can choose which metrics you want shown and the order in which they appear by selecting Choose Favorites from the Options menu.
Baselines and Anomaly Detection
Baselines represent the normal performance of an entity that allow you to compare the current performance with previous performance and help you set appropriate thresholds for performance metrics. Baselines are calculated by observing performance metric values over a period of time and applying machine learning algorithms to this data set.
By collecting performance metrics over a period of time, Oracle Infrastructure Monitoring identifies the normal expected range of values of particular metrics and saves them as baselines. When sufficient data points are collected, daily seasonality is automatically taken into account to further fine tune baseline calculations. In this case, each metric is given an expected range of values within each hour of a day. In addition, with more data collected, Oracle Infrastructure Monitoring also calculates the normal performance values within each day of the week. The system continues to fine-tune the data for each hour of a particular day of a week, concludes on a weekly seasonality if it is detected and includes that into the baselines calculation. For example, load metrics on a server may be expected to be at a higher range at 9:00 a.m. on a Monday and expected to be at a lower range at 9:00 a.m. on a Friday. Baselines are automatically calculated for all key performance metrics with no additional user input.
Metric values outside of the normal ranges are identified as anomalous and visually highlighted in performance charts. To receive alerts when metrics exceed normal baseline values, use the calculated baselines as guidelines and set the alert thresholds values outside of the normal ranges. For example, if a host CPU utilization is calculated to be normal between 60% and 75% on average days of the week and 65% to 80% on peak days of the week, then set your warning level alerts to 80% and a critical level alert to anything above 90%.
Metric Collection Errors
If there are errors encountered with the evaluation of a metric, then an alert of Metric Collection Error is generated. This alert is of critical severity.
-
You can see the alerts in the Alerts UI. You can get email by creating an alert rule with the alert condition "Metric Error".
-
You should look at the message of the alert and resolve the issue.
-
Once the issue is resolved, this alert will clear automatically when the agent can successfully collect the metric.
-
Any new metric collection errors will automatically generate an alert of 'Warning' severity instead of 'Critical' severity. All pre-existing metric collection error alerts of critical severity will remain as-is (i.e. no severity change).