PSFT Application Health Dashboard
This dashboard provides the overall health of the PeopleSoft composite.
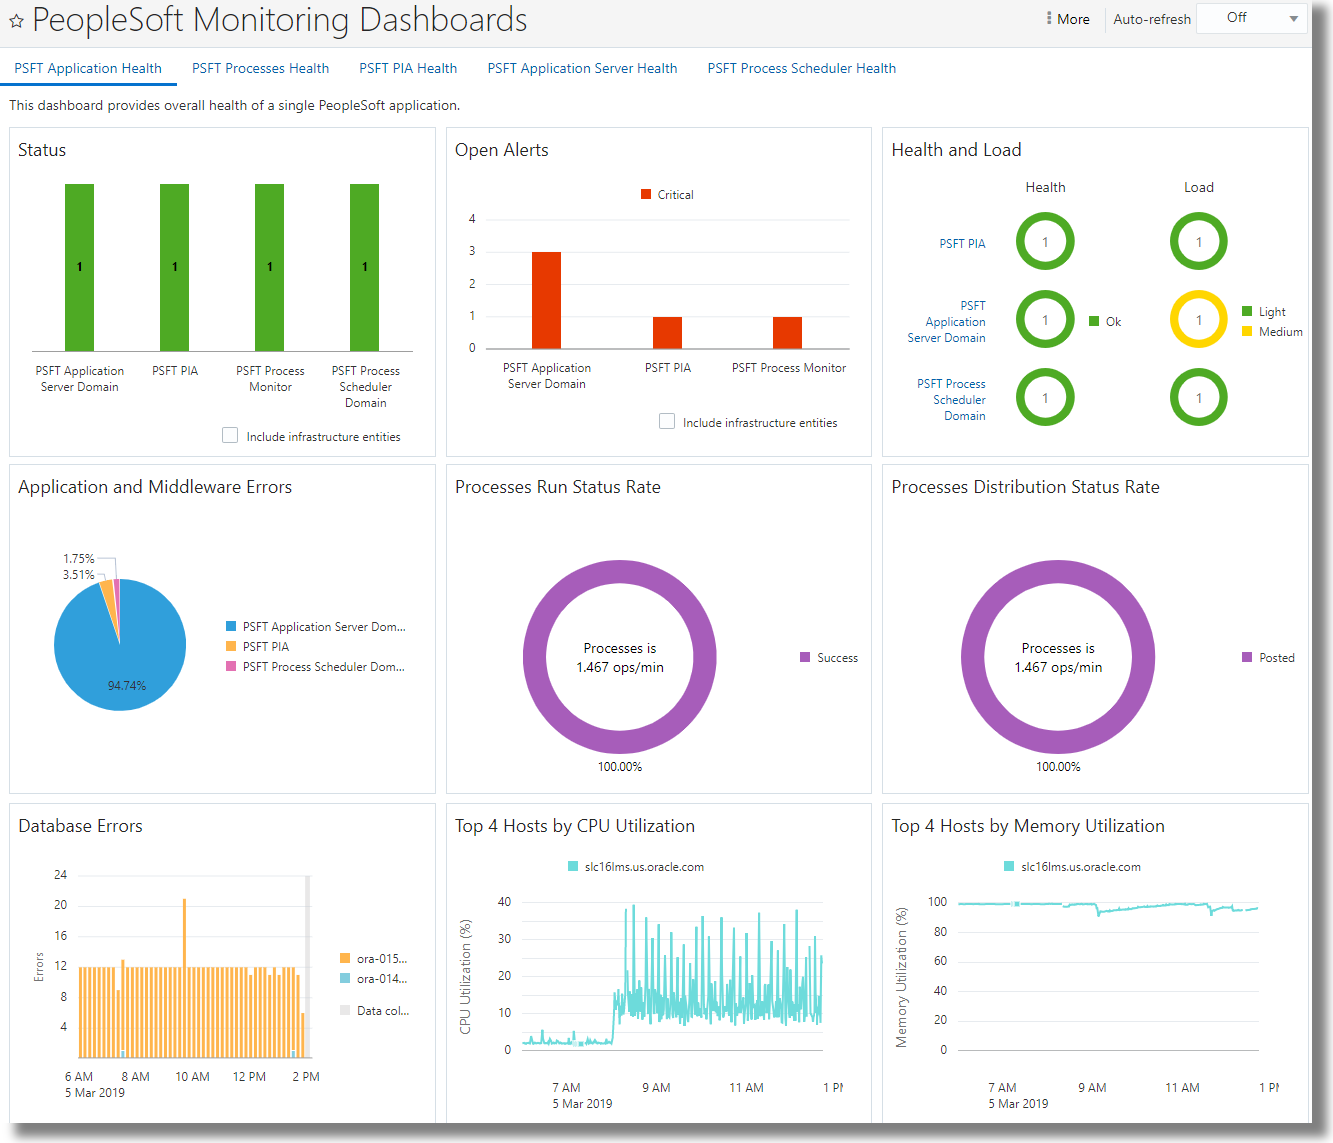
The PSFT Application Health Dashboard provides the overall health of the application so you can quickly identify potential problems. The dashboard offers in-context drill-downs into additional monitoring data, as well as providing additional log data to help you triage problems more quickly.
Here’s an example PSFT Application Health dashboard:

The following widgets are available on the PSFT Application Health dashboard:
-
Entity Status: Latest availability status across the PeopleSoft application. Changing the page-level time frame has no impact on the data displayed in this widget; the most recent collected data will always appear in this widget.
Note: To include data from infrastructure entities, select the Include infrastructure entities checkbox. -
Open Alerts: Open alerts across the PeopleSoft application. Changing the page-level time frame has no impact on the data displayed in this widget. The most recently collected data will always appear in this widget.
Note: To include data from infrastructure entities, select the Include infrastructure entities checkbox. -
Health and Load: Summary of the health and load of entities across the PeopleSoft application. Changing the page-level time frame has no impact on the data displayed in this widget. The most recently collected data will always appear in this widget.
-
Application and Middleware Errors: Summarizes errors found in log files associated with a PeopleSoft application - including logs from PeopleSoft Application Server Domain, PeopleSoft Process Scheduler Domain, PeopleSoft PIA as well as underlying Oracle WebLogic Server entities.
-
Processes Run Status Rate: Shows how many PeopleSoft processes have a run status value of Error, Cancelled or Success per minute since the last collection. Changing the page-level time frame has no impact on the data displayed in this widget.
-
Processes Distribution Status Rate: Shows how many PeopleSoft processes have a distribution status value of Posted or Generated per minute since the last collection. Changing the page-level time frame has no impact on the data displayed in this widget.
-
Database Errors: Summarizes errors found in Oracle Database log files associated with the PeopleSoft application.
-
Top 4 Hosts by CPU Utilization: Identifies the top four host entities with the highest CPU utilization over a period of time for the PeopleSoft application.
-
Top 4 Hosts by Memory Utilization: Identifies the top four host entities with the highest memory utilization over a period of time for the PeopleSoft application.