PSFT Process Monitor Dashboard
This dashboard summarizes the status and health of all processes (with the exception of processes with a run status of success) associated with a single PeopleSoft application.
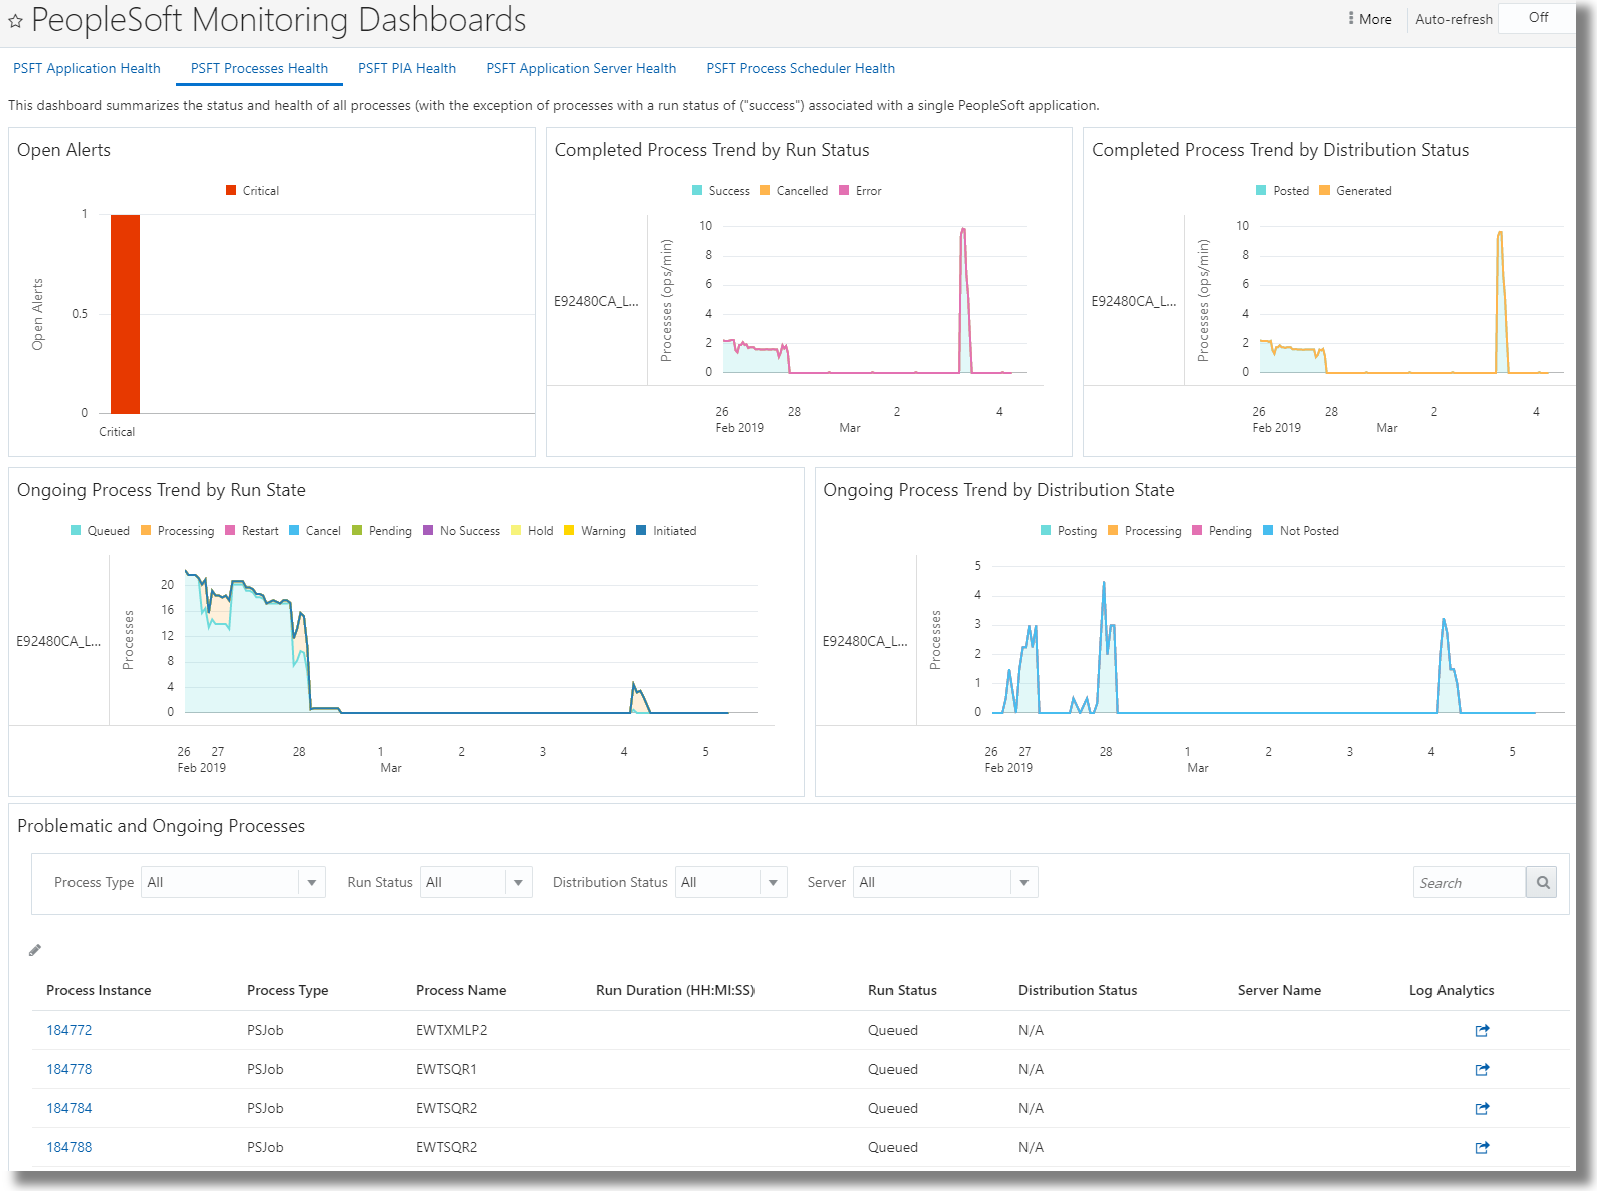
Here’s an example PSFT Process Monitor dashboard:

The following widgets are available on the PSFT Process Monitor dashboard:
-
Open Alerts: Open alerts from the process monitor
-
Completed Process Trend by Run Status: Stacked area chart showing the number of completed processes per minute classified by Run State (e.g. Success, Cancelled, Error)
-
Completed Process Trend by Distribution Status: Stacked area chart showing the number of completed processes per minute classified by Distribution State (e.g. Posted, Generated)
-
Ongoing Process Trend by Run State: Stacked area chart showing the number of ongoing processes classified by Run State (e.g. Queued, Processing, Restart, Initiated, Warning, Pending, Cancel, Hold, No Success)
-
Ongoing Process Trend by Distribution State: Stacked area chart showing the number of ongoing processes classified by Distribution State (e.g. Posting, Processing, Pending, Not Posted)
-
Problematic and Ongoing Processes: Lists all ongoing and problematic processes. This widget does not show the successfully completed processes