 Analyzing Database Inefficiency
 Before You Begin
This 10-minute tutorial shows you how to use Performance Analytics: Database to view database performance metrics, analyze trends, and identify inefficiencies.
Background
Performance Analytics: Database lets you analyze database performance issues across your enterprise, and identify the underlying systemic causes of the performance issues.
What Do You Need?
- A subscription to Oracle Management Cloud – Enterprise Edition.
- An instance of Oracle Management Cloud. See How Do I Access Oracle Management Cloud? in Getting Started with Oracle Management Cloud.
- Oracle IT Analytics enabled on the application that you want to analyze. See Typical Workflow for Enabling Oracle IT Analytics on Entities in Managing Oracle Management Cloud Entities.
 Access the Resource Analytics: Host Application
After you've signed in to and have created an Oracle Management Cloud instance, the Management Cloud tile is displayed on the main dashboard.
- Click Action Menu on the Management Cloud tile on the main dashboard, and click View Details.
- Click the Show:Active drop-down list and select Active to view active instances.
- Click Launch Management Cloud against the instance you want to access.
The Oracle Management Cloud console home page is displayed.
- Click the global navigation menu
 on the top left, expand IT Analytics, and select Database Performance Analytics.
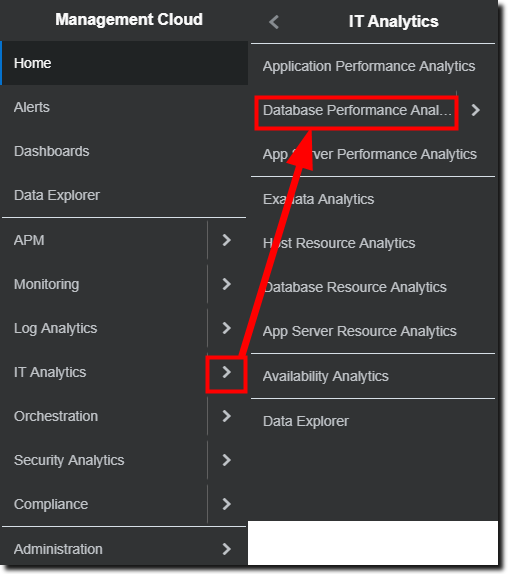
Description of the illustration dbpa_access.png
 View Database Performance Metrics
Performance Analytics: Database lets you view the change in activity and demand for databases with the highest performance degradation.
- In Performance Analytics: Database, navigate to the Performance Degradation section to view the demand-activity graph of all the databases in the system along with the count of databases in each degradation category.
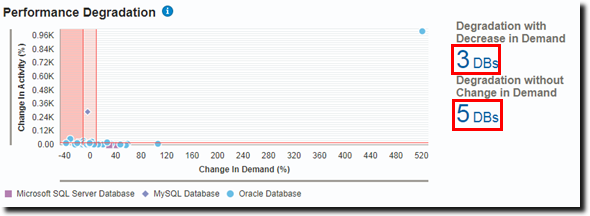
Description of illustration perf_degrade.png - Click the the value for category (Degradation with Decrease in Demand and Degradation without Change in Demand) to open a list of the top databases within that specific category, along with the database type, change in activity, and change in demand for each.
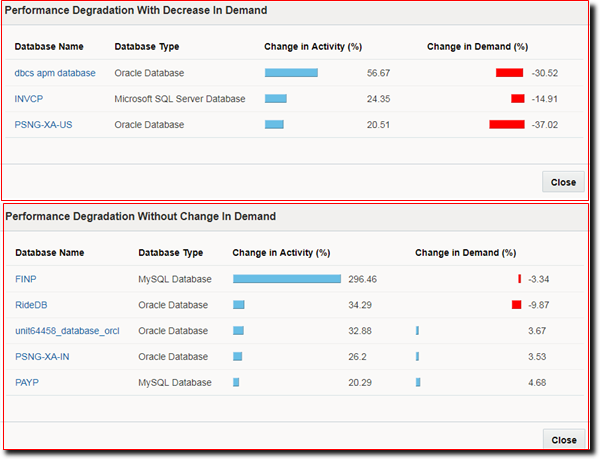
Description of illustration perf_degrade_dbs.png - Navigate to the Workload Variability section to view the relative variability of SQL statements against response time variation along with a count of SQLs with Highly Variant Performance.
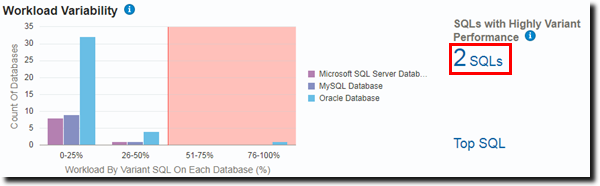
Description of illustration workload_var.png - Click the value for SQLs with Highly Variant Performance to open a list of SQLs that are highly variant, along with the database name, database type, relative variability, change in response time, and count of execution plans.
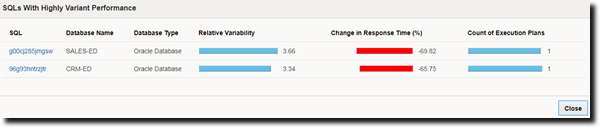
Description of illustration highly_variant_sqls.png Variant SQLs are the ones whose relative variability is high. Highly variant SQLs are the ones that need attention. Varying SQL statements have a relative variability greater than 1.66, and highly varying SQL statements have a relative variability of more than 3.
- Click the SQL name to drill down to the SQL details to find out the cause behind the highly variant performance.
SQL statements that are highly varying in performance need attention to ensure they have a stable response time.
 Identify the Most Inefficient Databases
The Performance Analytics: Database application presents you with a list of your most inefficient databases. It also points out the increasingly inefficient databases among them. This lets you quickly identify which databases are most in need of attention.
Databases that are more than 50% inefficient and those that are increasingly inefficient are considered to be your most inefficient databases. Inefficiency percentage of an SQL is derived from the inefficient wait time (wait time other than I/O, CPU, or idle wait time events) divided by the total database time.
- In Performance Analytics: Database, navigate to the Database Inefficiency section to view the performance of your databases based on a database inefficiency percentage.
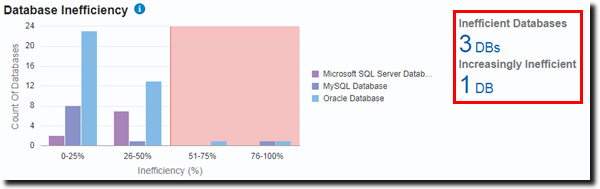
Description of illustration db_inefficiency.png - Click the value for Inefficient Databases to open a list of databases that are highly inefficient, along with the database type, inefficiency percentage, and change in inefficiency percentage.
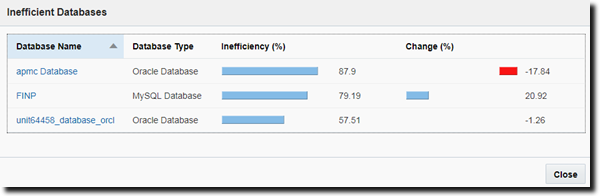
Description of illustration inefficient_dbs.png - Click apmc Database.
The Performance Trend tab displays that there has been a 303% rise in activity whereas the demand has been slowly going down.
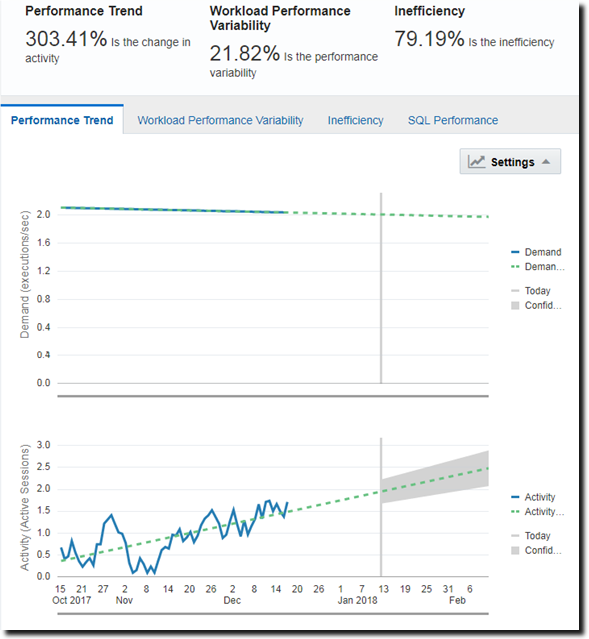
Description of illustration perf_trend.png - Click the Inefficiency tab to view a chart displaying the inefficiency of your database according to the number of active sessions involved in I/O, CPU, and inefficient waits.
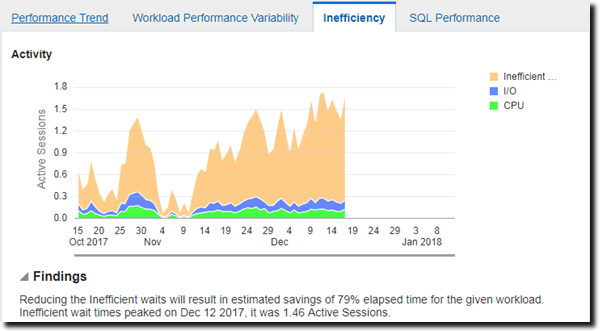
Description of illustration increasing_inefficient.png You can see that the inefficient wait sessions are way higher than the I/O and CPU sessions. Viewing this chart you can determine whether the inefficient waits can be reduced to improve the performance of your application.
 Analyze the Inefficient Databases
Now that you've identified FINP as an increasingly inefficient database, you can view the details of the various performance aspects of the database in Oracle Infrastructure Monitoring.
- Click the Global Context bar and type
FINPto display a drop-down list with entity names matching FINP is displayed.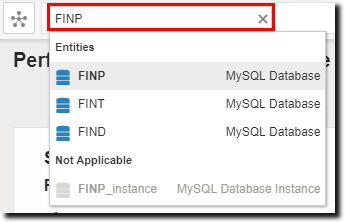
Description of illustration type_finp.png - Select FINP.
- Click the global navigation menu on the top left, navigate back to the Management Cloud list, and select Monitoring.
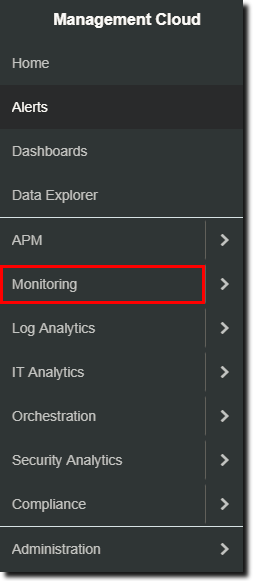
Description of illustration select_monitoring.png The Oracle Infrastructure Monitoring page opens with details regarding the increasingly inefficient database, FINP.
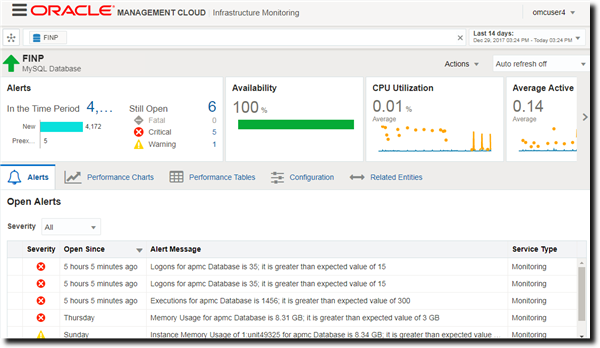
Description of illustration im_landing.png - In Oracle Infrastructure Monitoring, click the Performance Chart tab to view and analyze the various performance metrics related to FINP.
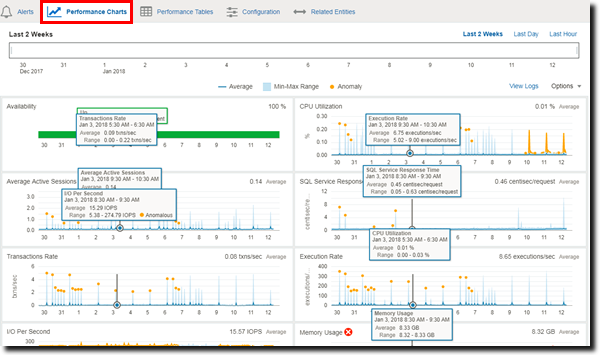
Description of illustration finp_perf_charts.png
You can determine ways to reduce the inefficient wait time of the FINP database by looking at all the performance metrics.
 Want to Learn More?
- Analyze Database Inefficiency in Using Oracle IT Analytics
- Manage Entities Using the Administration Console in Managing Oracle Management Cloud Entities
- Monitoring Performance Within Each Tier in Using Oracle Infrastructure Monitoring