29 Diagnostics
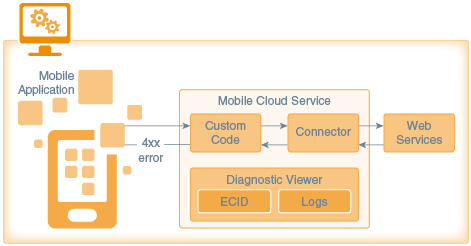
The Diagnostics features of MCS provide live performance data and quick access to detailed log messages for each API and connector request. If you are an administrator, you can use these features to monitor performance and error rates and to debug any problems that arise. If you are a developer, these features help you debug your code.
What Can I Do with Diagnostics?
Whether you’re a developer tracing errors in custom code, or an administrator who notices a flurry of 5xx responses, Diagnostics lets you easily find out what’s going on by providing you with increasingly detailed levels of logging messages.
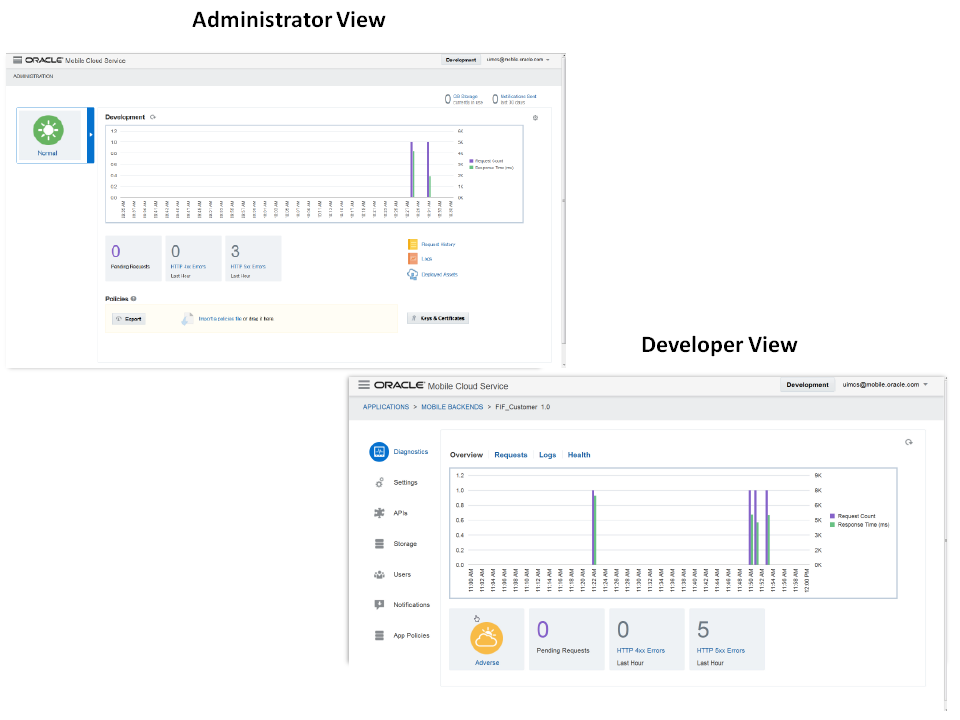
Diagnostics presents request and error data in two different views: the Environments page, used by mobile cloud administrators, and the Diagnostics page that is specific to a single mobile backend, which developers use.
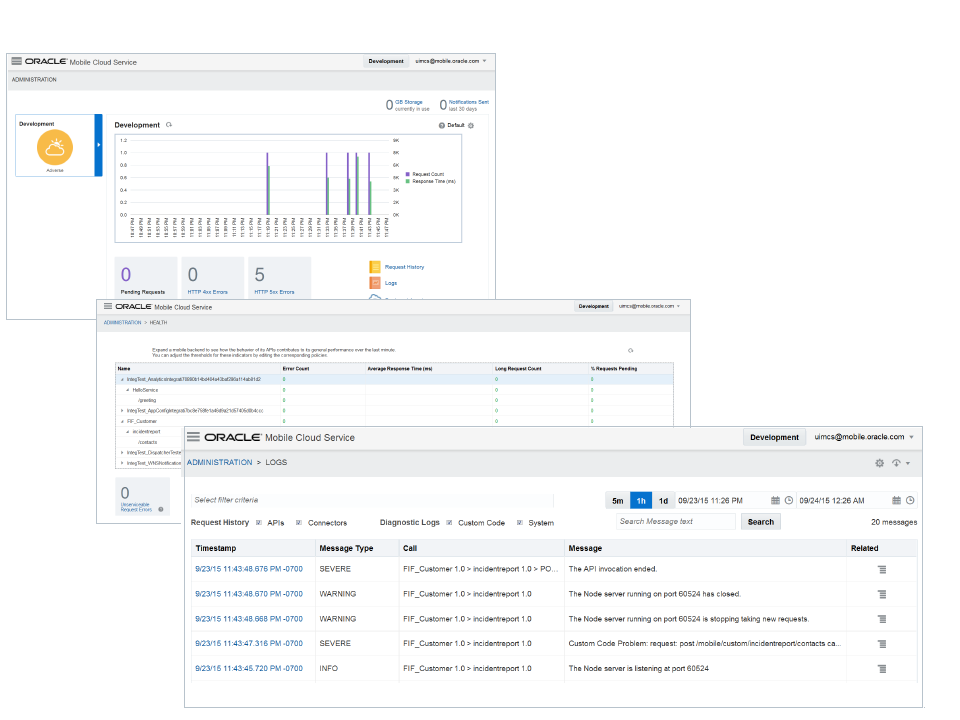
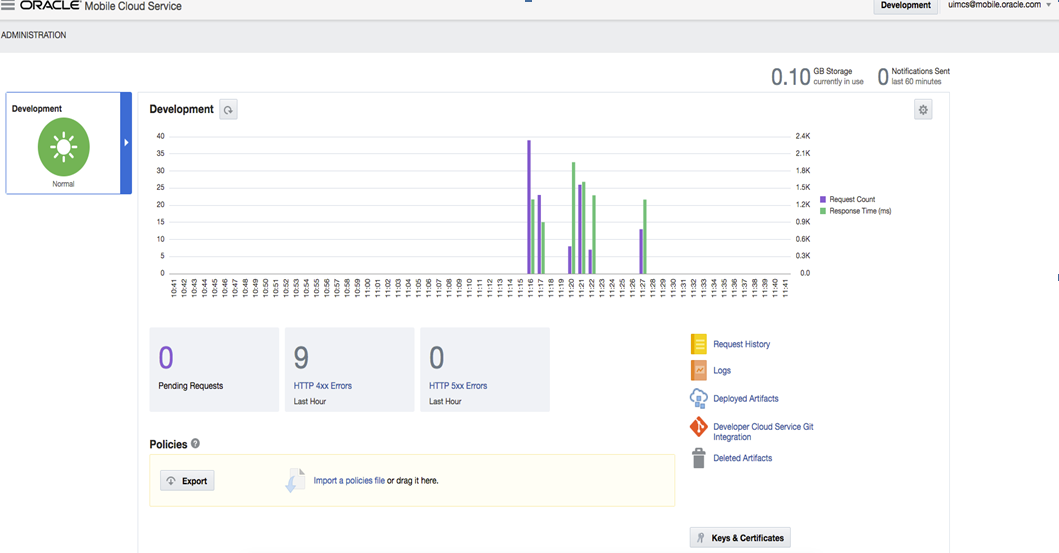
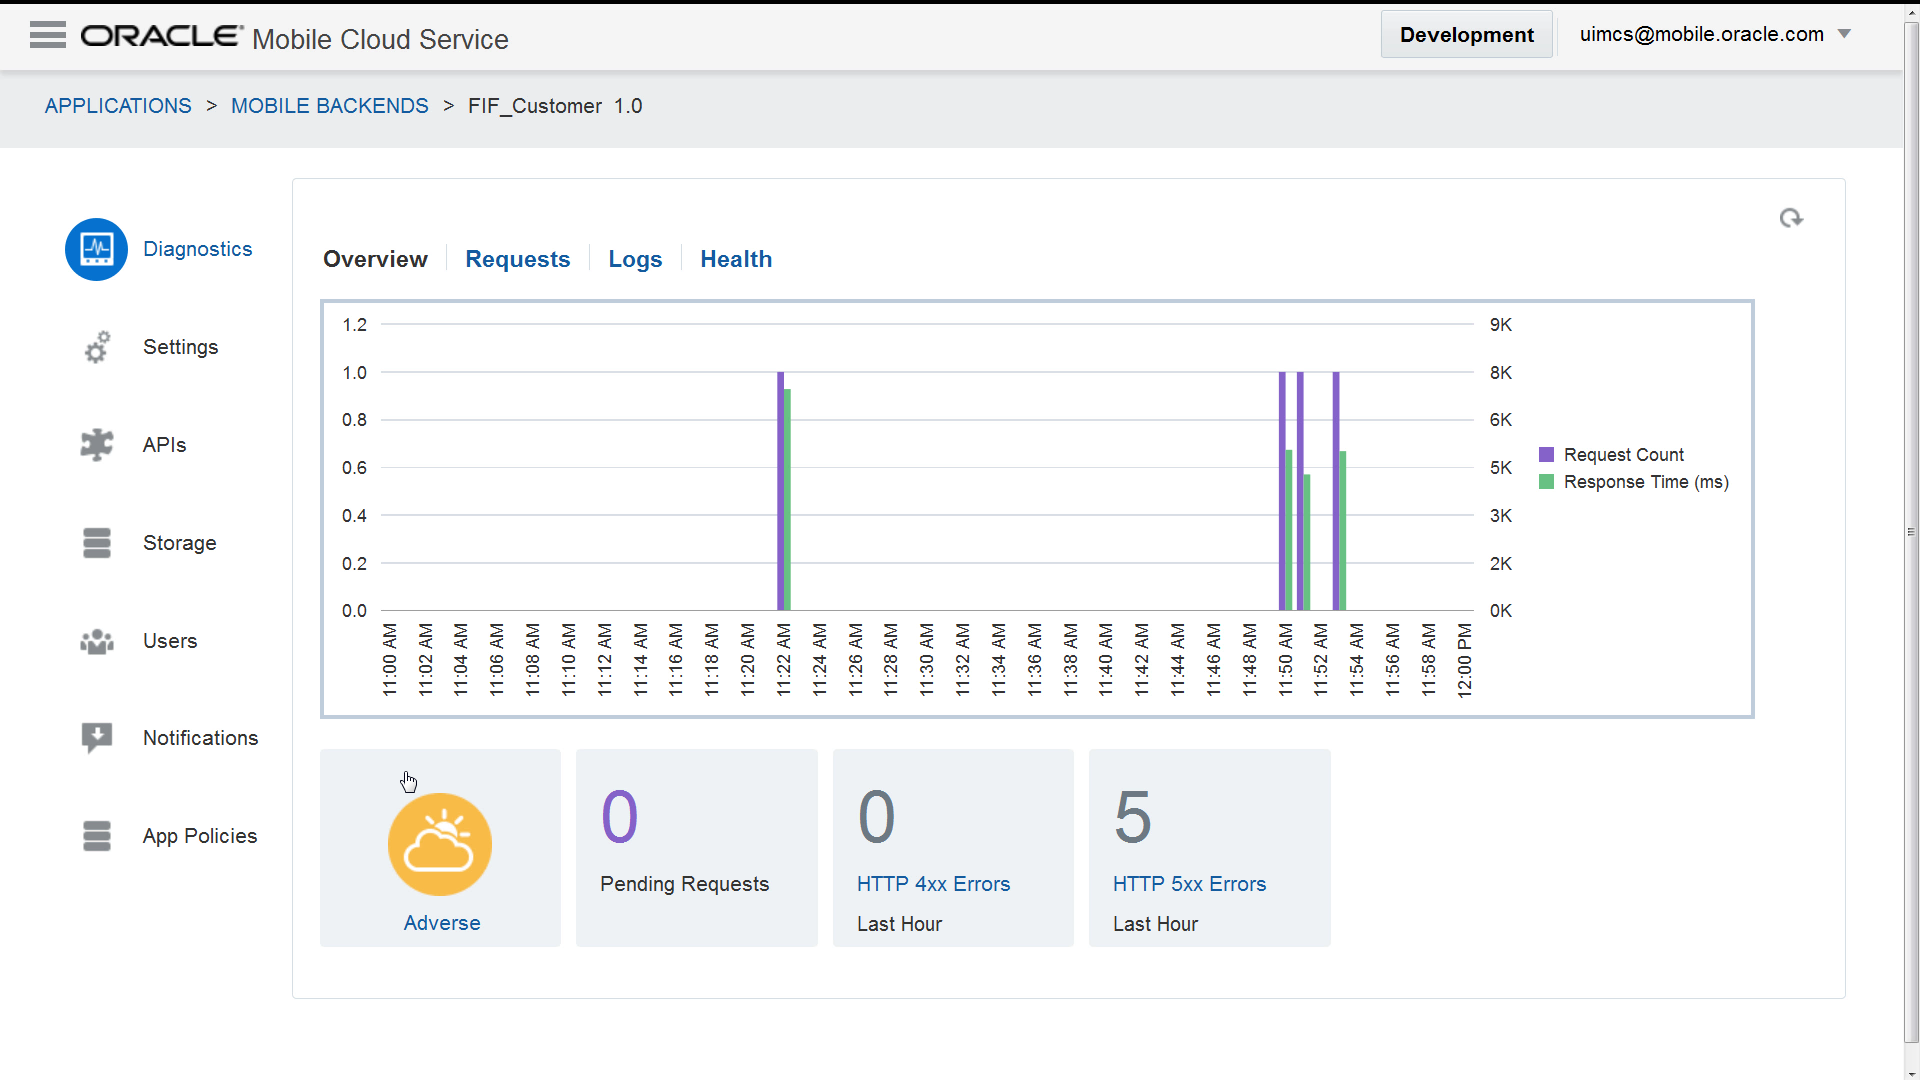
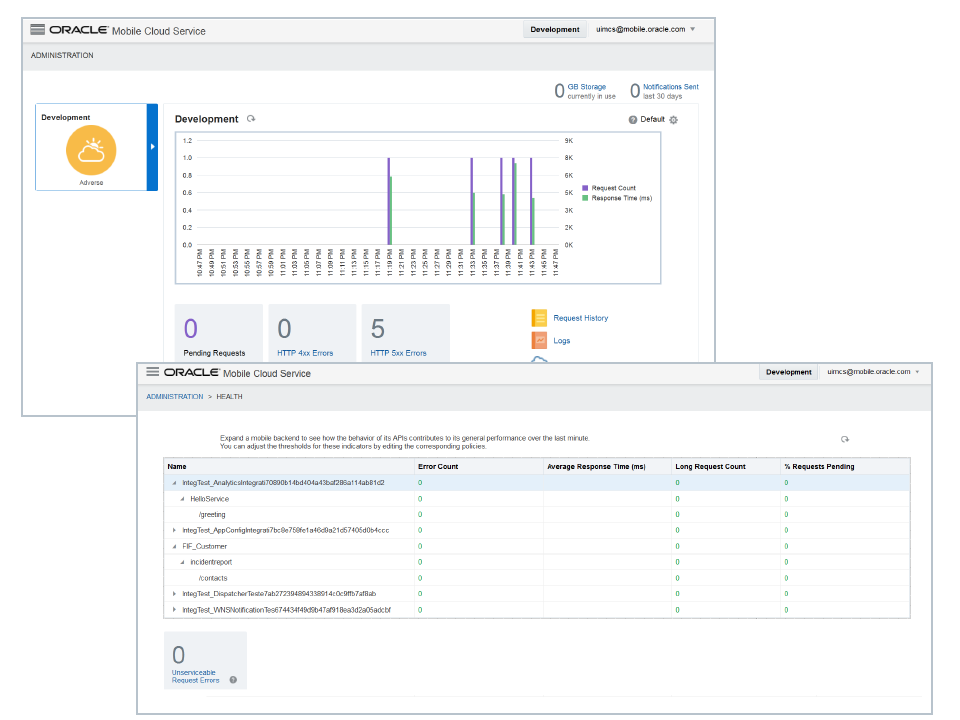
Both the Diagnostics page and Environments page enable troubleshooting for app responsiveness and errors. They provide a high-level view that includes traffic-light indicators that convey overall environmental health, a timeline that plots requests and responses, and also counters to tally the failing requests resulting in HTTP 4xx and HTTP 5xx errors. These pages provide the entry point to more detailed levels of analysis, because you can drill down from an indicator or an error counter to identify which requests are failing and view log records that are associated with them. For more about going from these top-level pages to specific logs, see Viewing Underperforming Requests.
If you’re a mobile cloud administrator who wants to go to the Environments page, click ![]() and select Administration from the side menu.
and select Administration from the side menu.
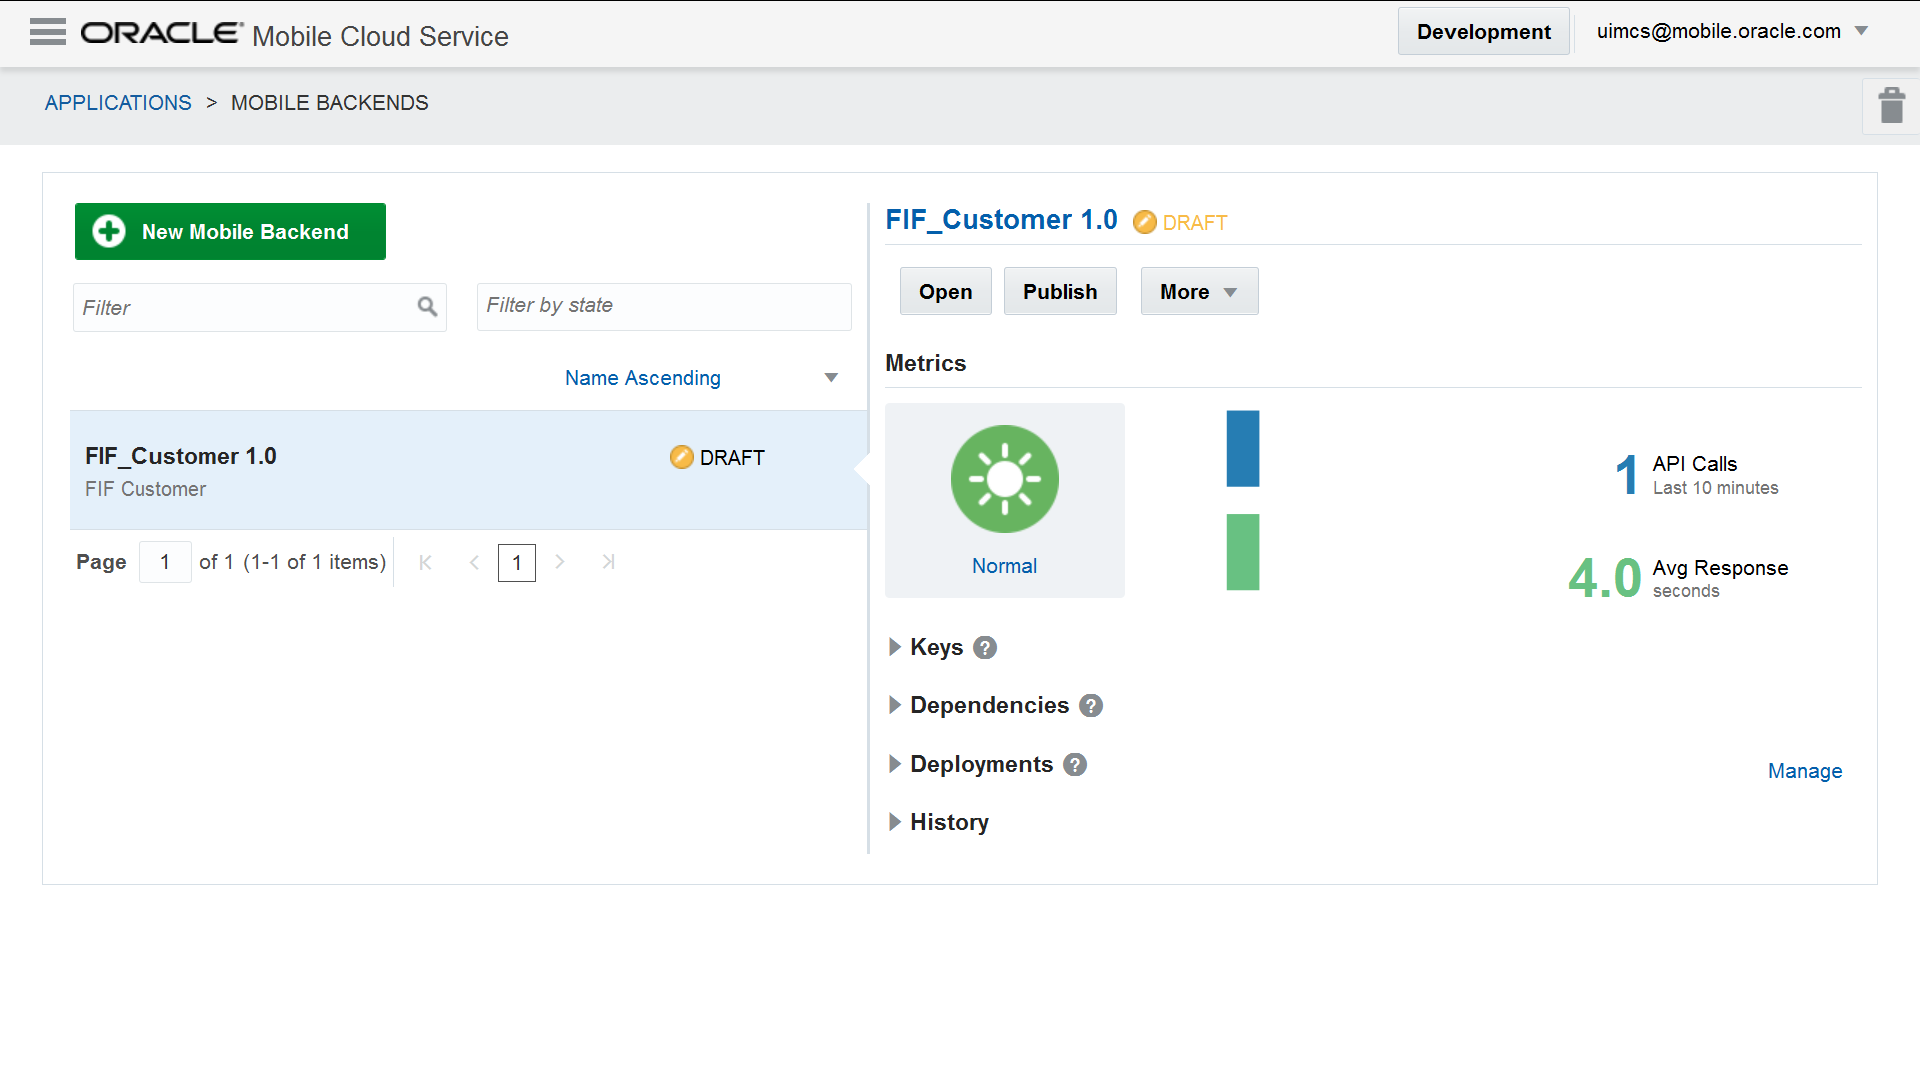
If you’re a developer who wants to go to the Diagnostics page, click ![]() and select Applications > Mobile Backends from the side menu, then select your mobile backend and click Open.
and select Applications > Mobile Backends from the side menu, then select your mobile backend and click Open.
Although the Environments page (administration view) and Diagnostics page (developer view) appear to be similar, they’re used differently. As pointed out in Monitoring Environments for a Selected Mobile Backend, developers typically use a mobile backend’s Diagnostics page as the starting point in their debugging efforts. To get an idea how developers go through their paces starting with this page, see Use Case: Using Correlation to Diagnose Custom Code. While developers focus on one mobile backend, mobile cloud administrators instead monitor all of the environments in the system. The same performance and error metrics that are displayed in a mobile backend’s Diagnostics page are also available from the Environments page, though here they comprise the behavior of all of the backends deployed to a selected environment. For an example of how a mobile cloud administrator goes from this page to access logging data, see Use Case: Using Correlation to Diagnose Connector Issues.
Viewing Environment Health
The green, amber, and red traffic-light indicators in the Environments and Diagnostics pages depict the overall health of an environment for the last minute. MCS bases this at-a-glance view on the fine-grained health metrics for that environment. When the number of errors and current request or response times exceed configured thresholds, the traffic-light indicator changes from green (normal) to amber (adverse) or red (severe).
Note:
The throughput (and number of errors) varies by environment: development environments typically have more errors and lower throughput. In contrast, production environments are characterized by fewer errors and higher throughput. See Adjusting the Performance Threshold Configurations.
Viewing Server Load
As part of the overall portrait of health at any given moment, the Environments and Diagnostics pages include a timeline that plots a recent history of the number of requests and response times. The pages also include the number of pending requests.
Viewing Errors
The Environments and Diagnostics pages note the number of client (4xx) and server (5xx) errors that have occurred within the last hour.
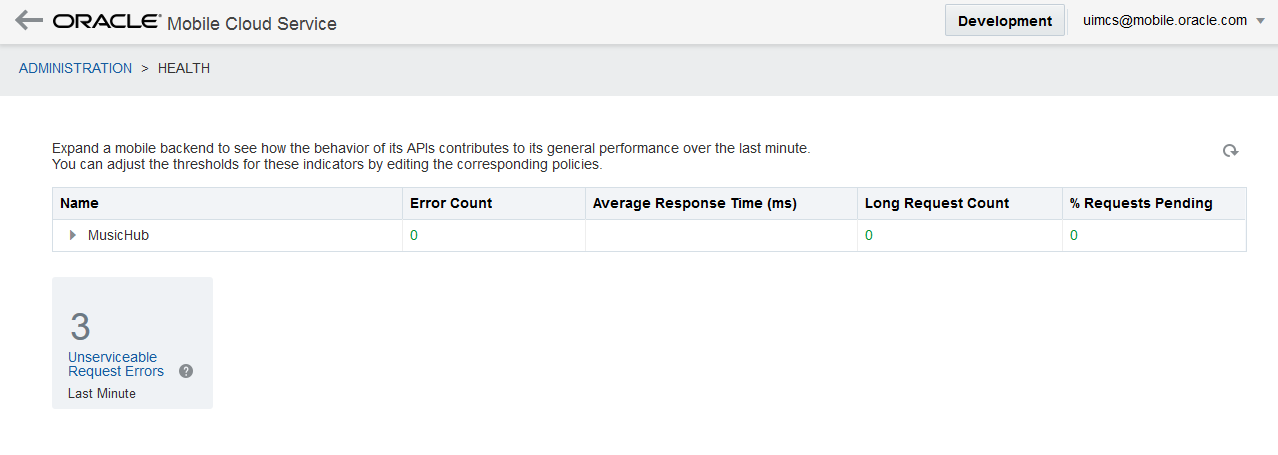
For the overall environment, MCS includes the number of unserviceable requests, errors which occur when requests fail to identify any mobile backend or API endpoint.
Note:
Unserviceable requests aren’t associated with mobile backends. They are instead associated with an environment.Viewing Underperforming Requests
The high-level data presented on the Environments and Diagnostics pages is the entry point for increasingly detailed levels of analysis. When you hover over an indicator, the console lists metrics derived from the last minute of the system's behavior: the number of errors, the average duration of requests, the number of pending requests, and the number of long-running requests. The console highlights the severity of the problematic metric by color, from green (healthy) to red (severe). From here, you can evaluate the root cause by clicking the traffic light to investigate problematic requests or APIs. For example, if the environment indicator shows a high number of errors, then you can investigate the cause by drilling down to the error logs for information on each request that results in an error. When the number of slow requests increases, you can drill down from the environment indicator to see which API requests are slow. You then can view the API history log data and get a breakdown of the requests and any child requests. See also Viewing Log Messages Related to a Request.
Viewing Log Messages Related to a Request
Rather than using various grep commands to find log records between time stamps in the logs,MCS uses correlation to associate log messages to a specific API request to help you locate the pertinent records from the API request history. If you're troubleshooting, then correlation lets you quickly find the root cause by presenting detailed information, such as invalid JavaScript code or an unavailable resource called by a connector. For more information, see Relating Log Messages. For more information about the various logs generated by Diagnostics (such as the API History, Connector History, Custom Code, and System logs), see Viewing Log Messages.
Viewing Storage Usage
In addition to showing API request data, the Environments page shows you information for your environment, in particular:
-
Storage: How much database storage, shown in gigabytes, the environment is currently using
-
Notifications: How many notifications have been sent in the past 60 minutes
You can see this information in the top right corner of the Environments page.
Monitoring a Selected Backend
The backend’s summary page gives you a snapshot of the current health of its environment. You can take a deeper look at request and response processing and error handling by selecting the backend and then clicking Open.
The Overview page displays the number of the requests and responses, plots them on a timeline, and notes the number of client and server (4xx and 5xx) errors. Because this page gives you a snapshot of the overall health of a mobile backend, you can focus your attention where its needed: on specific performance issues or problems with the API implementations and connectors used by the mobile backend.
While you can drill down through the Overview page to specific endpoint data, you can also view detailed API request and error information using the Health, Request History, and Logs pages.
Viewing API Performance
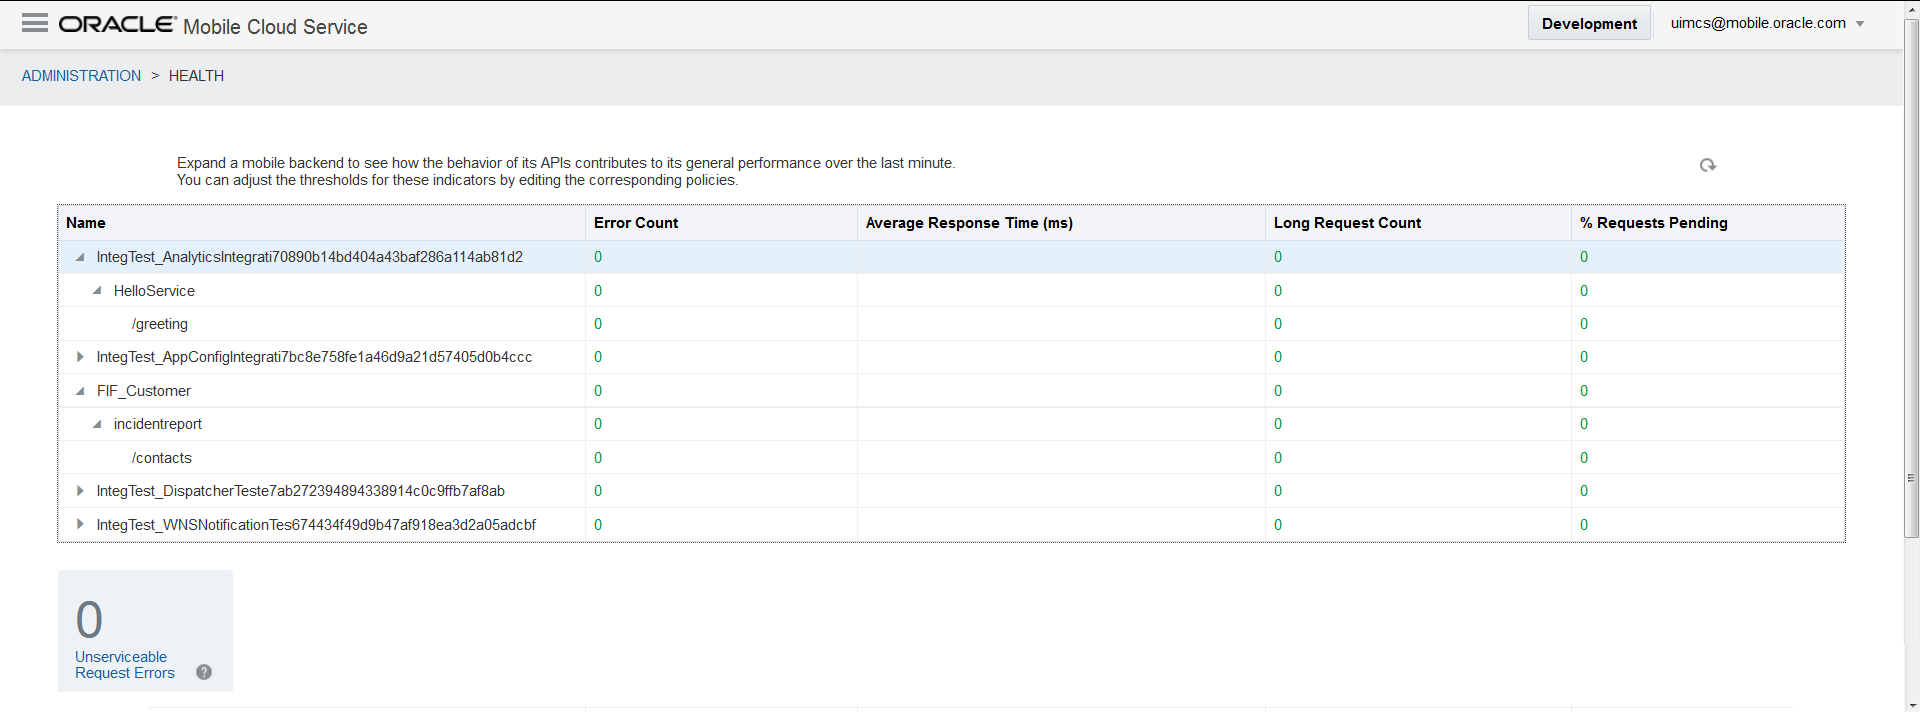
You can find out how the performance of a specific API contributes to the overall health of a mobile backend, or to an entire environment. For each API, MCS records the same error and request handling metrics that it applies to mobile backends and environments. You can drill down to see how the API endpoints behave in terms of these performance metrics.
In the Development page, you can view the APIs for a selected mobile backend using the Health page. You can also open this page by clicking the traffic indicator on the Overview page. If the traffic indicator is amber or red, then you can quickly investigate the cause by going to this page. Similarly, if an indicator for an environment has changed to amber or red in the mobile cloud administrator's Environments page, then you can open the Health Details page in a single click to find the problematic API.
What Do the Health Indicator Thresholds Mean?
| Threshold | Amber | Red | Comments |
|---|---|---|---|
|
Average Response Time |
When the average response time within the last minute is greater than (or equal to) 3 seconds (3000 ms). |
When the average response time within the last minute is greater than (or equal to) 6 seconds (6000 ms). |
This threshold is applied across all requests (successful and failed) over the last minute. Even though the average response times may indicate a healthy environment, the Long Request Count might indicate that some of the requests aren’t behaving well. |
|
Long Requests |
When any (that is, more than 0) long-running requests occur in the last minute. A long-running request to an endpoint server has a duration that’s greater than (or equal to) 8 seconds (8000 ms). Depending on the environment, the default configuration may not reflect an adverse (amber) warning. While the default configuration triggers an adverse warning when a long request exceeds 8 seconds and the number of long requests has increased from 0 within the last minute, you might instead want to define an adverse warning when more than 10 long-running requests (which exceed 4 seconds) occur in the last minute. |
When 10 or more long-running requests occur in the last minute. |
To find out why requests may be running long or failing, review the custom code or the system at the far end of an outbound connector. |
|
Percentage of Requests Pending |
When the number of pending requests (expressed as a proportion of all requests over the last minute) is greater than (or equal to) 25%. |
When the number of pending requests (expressed as a proportion of all requests over the last minute) is greater than (or equal to) 30%. |
Pending requests represent the ratio of in-flight requests to the number of in-flight requests, as well as successful, and failed requests within the last minute. Pending requests don’t necessarily indicate problems. They occur in both normally functioning, evenly loaded systems and also in erratic systems that are characterized by spikes in active requests. Evenly loaded and erratic systems require different proportions of pending requests. The proportion threshold that indicates a particular level of health in the request backlog may differ for these two types of systems; in evenly loaded systems, for example, MCS displays an adverse warning if the request backlog is 25% of active requests. While this default setting may be too lenient for erratically loaded systems, a reduction to 5% may be too severe because of spikes in active requests that jump to 10% may alternate with periods when no active requests are present. The thresholds set for the backlog depend on both the average request duration and the request density function over time. Remember that a high proportion of pending requests in erratically loaded systems doesn't signify problems as long as they’re handled in a timely manner. |
|
Failed Requests |
When any failed requests occur in the last minute. |
When 10 or more failed requests occur in the last minute. |
When applying thresholds, Diagnostics counts of unserviceable requests are counted alongside failed requests. |
|
Errors |
When the error count in the last minute is greater than 0. |
When there are 10 (or more) errors in the last minute. |
|
|
Unserviceable Requests |
When any unserviceable requests occur in the last minute. |
Diagnostics factors the thresholds for both failed requests and unserviceable requests into its assessment of the overall health of an environment. When unserviceable requests occur, review the requests made by the mobile app. Diagnostics might classify a request as unserviceable because it uses an incorrect URL. See also Viewing Status Codes for API Calls and Outbound Connector Calls. |
Tip:
Ask your mobile cloud administrator to redefine these thresholds if they don't apply to your mobile backend or environment. For more information on the Diagnostics policies, see Oracle Cloud Service Environment Policies. See also Adjusting the Performance Threshold Configurations.Note:
MCS provides preconfigured thresholds to determine the API health within the context of both environments and mobile backends.
These thresholds don’t apply to connector (endpoint server) requests.Adjusting the Performance Threshold Configurations
The default thresholds may not apply at all phases of the mobile backend's lifecycle and may not always reflect your interpretation of a healthy environment. For example, a development environment might be more tolerant of unserviceable requests than a production environment. Using the Environments page, mobile cloud administrators can obtain the policies file that contains the default configurations by clicking Export. After they adjust the thresholds, they can import the file by dragging it into the Policies pane.
See also Environment Policies.
Viewing Status Codes for API Calls and Outbound Connector Calls
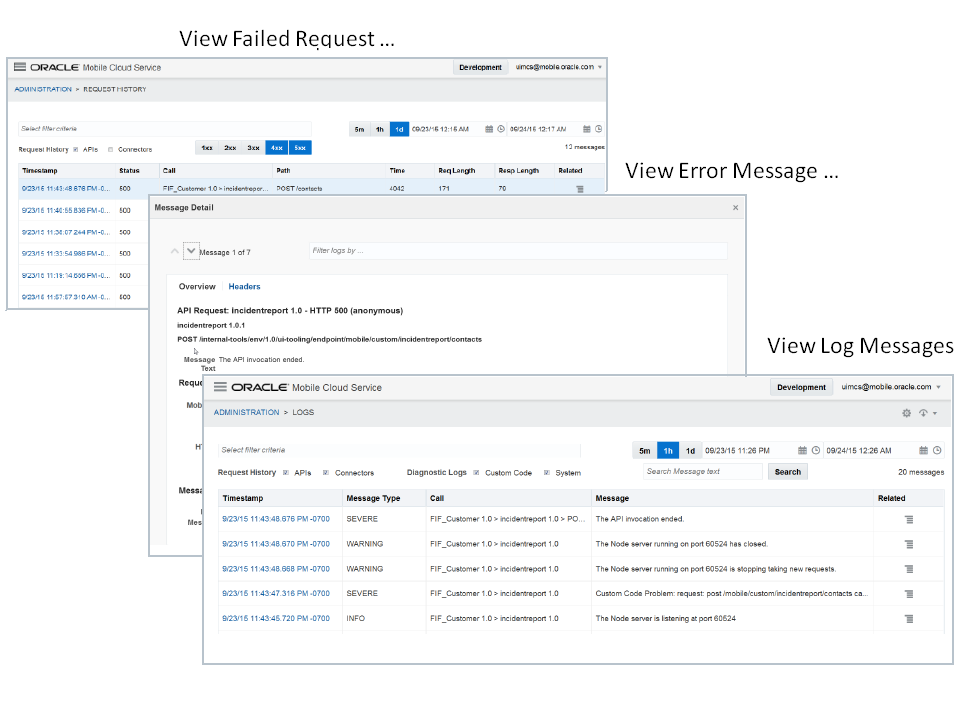
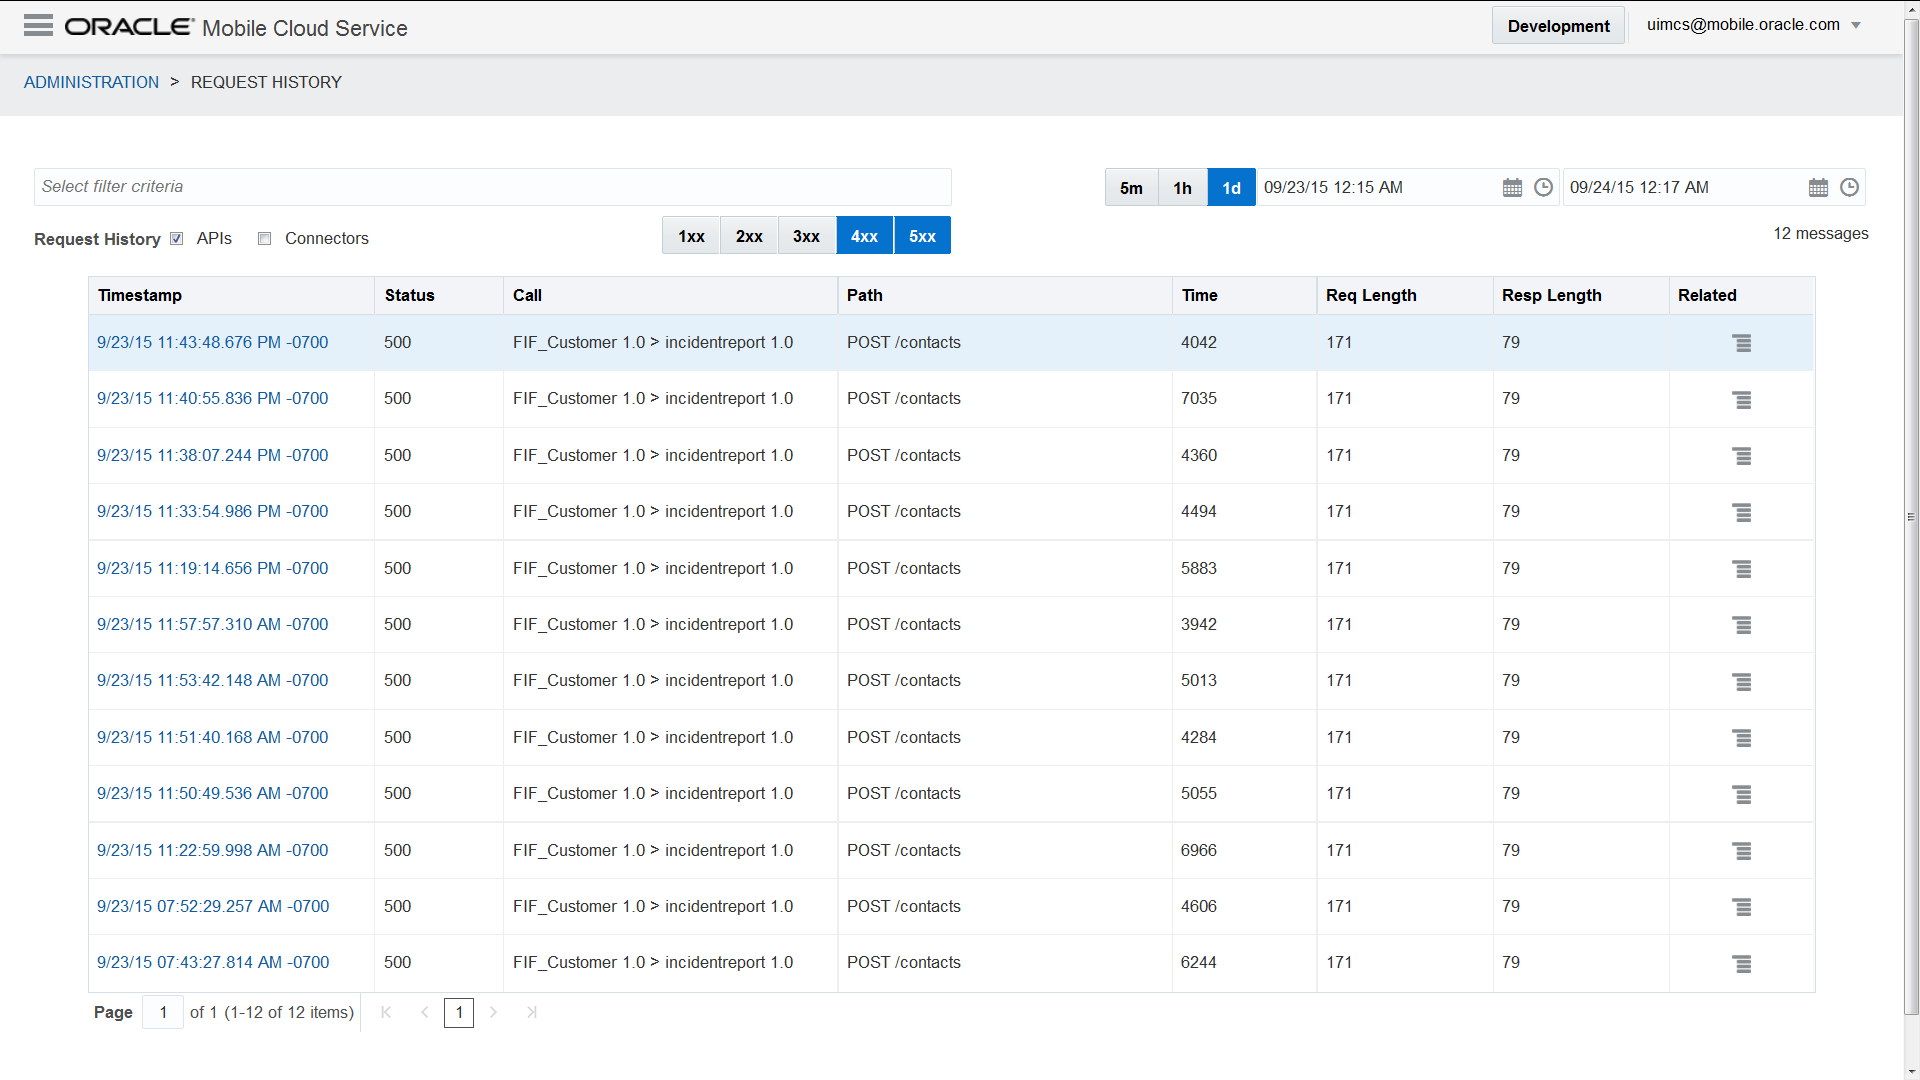
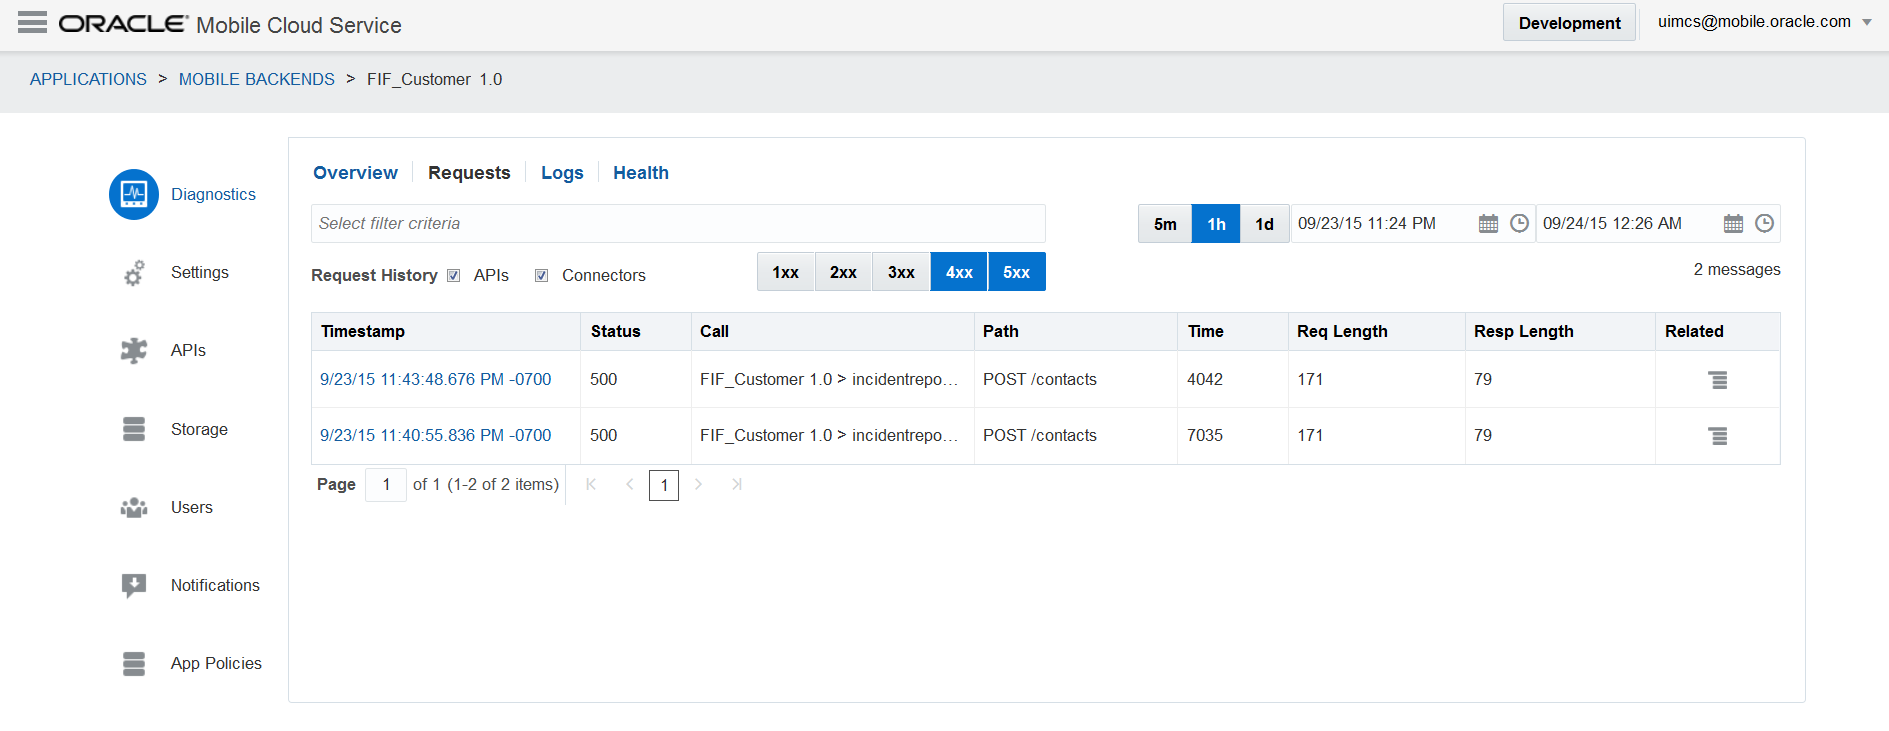
When you open the Request History page, its 4xx and 5xx status code buttons are selected by default, displaying the client (4xx) and server (5xx) HTTP status codes for the API's endpoints and the outbound connector calls made within a single backend (if you're a developer) or across all backends (if you're an administrator). This page gives you a glimpse into the context of the status code, letting you trace the causes for various status codes.
Tips:
-
Clicking the time stamp opens the message itself.

See Viewing Message Details
You can learn more about the API call or outbound connector request by looking at the page's Call and Path columns, which show you a description of the targeted resource as well as the action and object of the request.
The table that lists the calls displays the sizes of the request and response in bytes as well as the response time. If a slow response time might indicate a problem, then you can troubleshoot the issue using correlation. See Viewing Log Messages Related to a Request.
| Request Type | Content Displayed in the Call Column | Content Displayed in the Path Column |
|---|---|---|
|
API requests that are returned 200 (Success) |
The backend name, version > API name and version. For example:
|
The HTTP method with the resource path. For example:
|
|
API requests that are returned 5xx (Unserviceable Requests) status codes |
The backend name, version > API name and version (if available); otherwise this column is blank.
|
The HTTP method and information about the resource path. For example:
|
|
Outbound Call from a SOAP Connector |
The endpoint URL, such as:
|
The operation name. For example:
|
|
Outbound Call from a REST Connector |
The host, such as: |
The method with the resource path. |
-
400 - Bad Request -
404 - Not Found -
408 - Request Time Out -
500 - Internal Server Error -
501 - Not Implemented -
503 - Service UnavailableFor a complete list of HTTP status code definitions, see
http://www.w3.org/Protocols/rfc2616/rfc2616-sec10.html.
Relating Log Messages
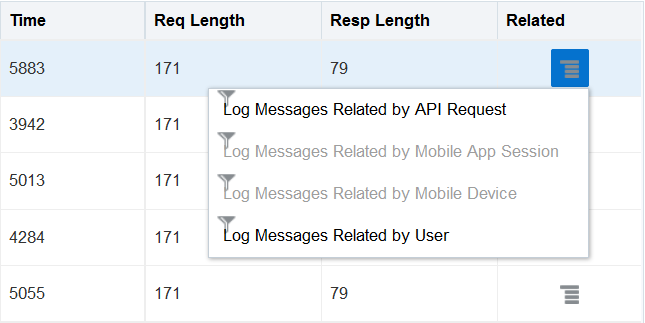
For each request, you can use correlation to get the logging data to a request by using the options in the Related Logs column. You can correlate log records by app session, mobile device, user, and API request.
To query a list of log records that are tagged with the correlation ID for the request, select Log Messages Related by API Requests. After you select this option, the Filters field is populated by the request's correlation ID. The messages displayed in the Logs page were generated during the servicing of the request.
Tip:
You can also generate a list of request-related messages by clicking the funnelHow Client SDK Headers Enable Device and Session Diagnostics
When you use the client SDK for your mobile platform in your apps, the SDK injects the mobile diagnostic session ID (M_DSID) into request headers. Because the client SDK is optional, app developers can override this behavior by setting their own headers.
Oracle-Mobile-DEVICE-ID and Oracle-Mobile-SESSION-ID headers, described in SDK Headers, enable Diagnostics to correlate records when you select the Log Messages by Mobile Device and Log Records by Mobile App Session options. While the server automatically generates the correlation ID for each request, the mobile app adds diagnostic capabilities by providing the session and device IDs. App developers can define how sessions are expressed. For example, they can group requests as a single session. App developers can also define the device ID to distinguish requests. A device ID isn’t the device manufacturer ID, but rather an ID assigned by the developer to the user’s device.
Note:
A single user can operate multiple devices that run the same app. The app may exhibit problems on only one of the devices.Administrators can use this ID to differentiate a request message that’s specific to an app user’s device amid thousands of other messages. Without this header, administrators can still correlate records by a user because users are established through authenticated requests.
Viewing Log Messages
You can access this page by selecting from the logging options in the Related column in the Request History page, or by clicking Logs on the top-level health page.
If you're an administrator, then view the logging data by either drilling down from the Related column in the Errors page or by clicking Logs on the Environments Page. The Logs page lets you view the following logs, either singly or in any combination:
-
API —These messages describe the REST API calls received by a single backend (if you're a developer), or all backends (if you're administrator). These messages are logged in the API History log. See Taking a Look at Exported Messages.
-
Connector—These messages describe the outbound calls made by the connectors to SOAP or REST endpoints. These messages help you to troubleshoot problems arising from incorrect connector and endpoint configurations as well as those related to the downstream resource itself (connection timeouts, service unavailable, or other situations that result in 5xx status code messages). See Connector Message Details.
- System log—These messages can describe a general problem encountered byMCS (for example, it can't send notifications to providers like Apple Push Notification Service or Google Cloud Messaging) as well as the cause of the problem (such as an incorrect configuration that prevents a mobile app from sending notifications).
-
Custom Code—These messages describe the issues logged through the custom code service container. These messages include the ones that are generated by the custom code service itself about the starting and stopping of the Node.js instance and messages created by service developers using the Node.js'
consoleobject.
In addition to the log buttons, you can view the log messages by date using either the presets or the date editor. 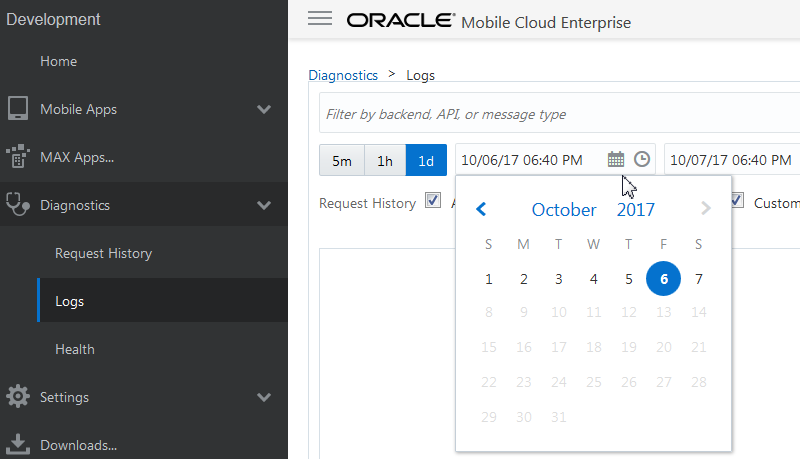
You can also apply filters, so that you can view messages by message type, backend, backend version, and API name. You can add filters by selecting from the drop down list, or by entering some criteria in the Filters field. For example, if you're interested in a particular backend, then enter its name in the Filters field.
Tip:
If you don't see any log records, then try selecting different sources of log information or a different time interval.The Logs page lists the log messages by time stamp. Just as you could on the Request History page, you can view the log message by clicking the time stamp.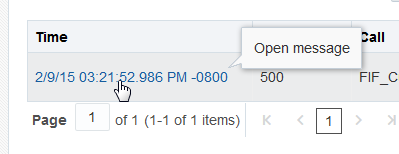
In addition to the logging level for the message, the page describes the related API, custom code, or outbound connector call in the Call column.
You can retrieve specific error messages by entering terms in the Message Text field, then clicking Search.
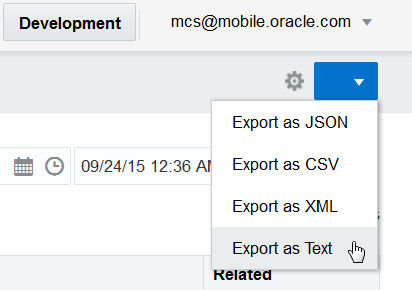
The Logs page displays up to 500 records. If your query returns more than 500 records, click Export ![]() to transfer all of the logging data to a local file that’s formatted in CSV, JSON, text, or XML. The export is restricted to 10,000 log records. See Taking a Look at Exported Messages.
to transfer all of the logging data to a local file that’s formatted in CSV, JSON, text, or XML. The export is restricted to 10,000 log records. See Taking a Look at Exported Messages.
Viewing Message Details
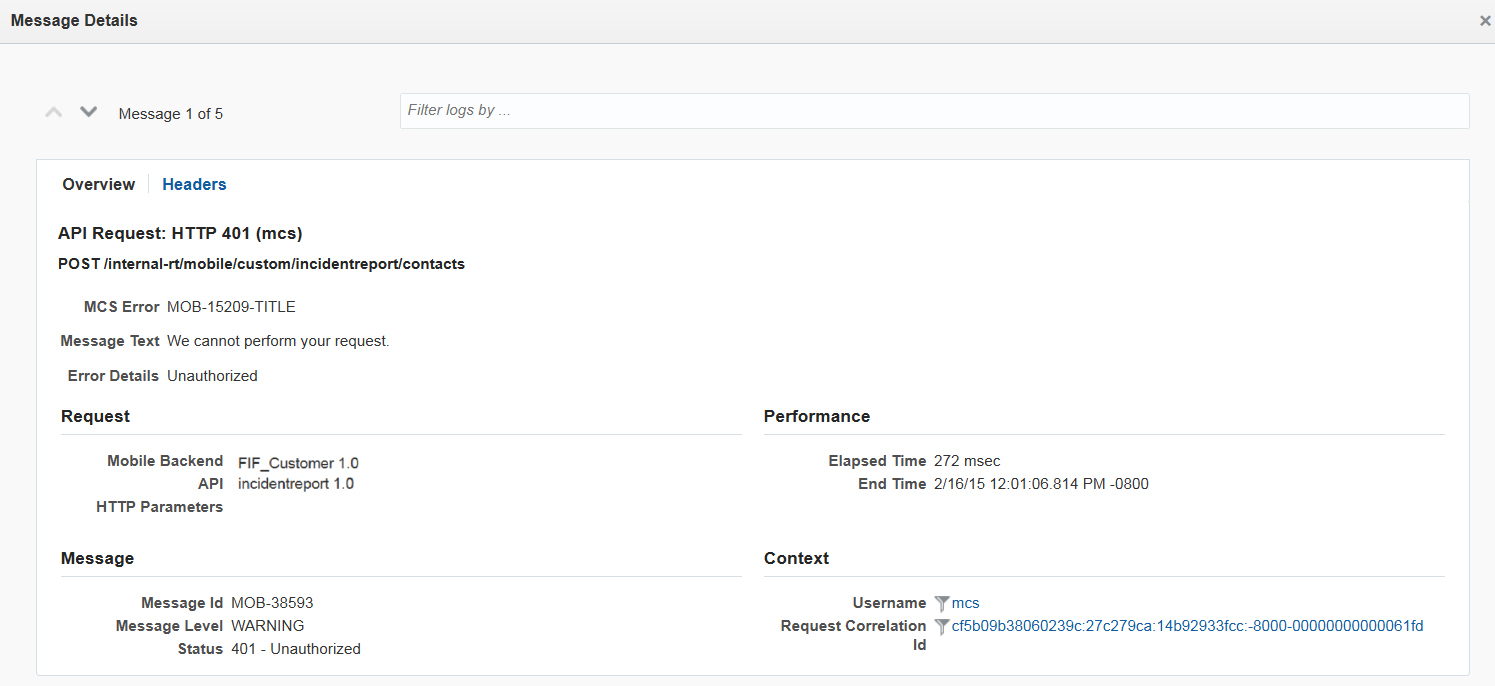
To find out more about a request, review the API history message by clicking the time stamp.
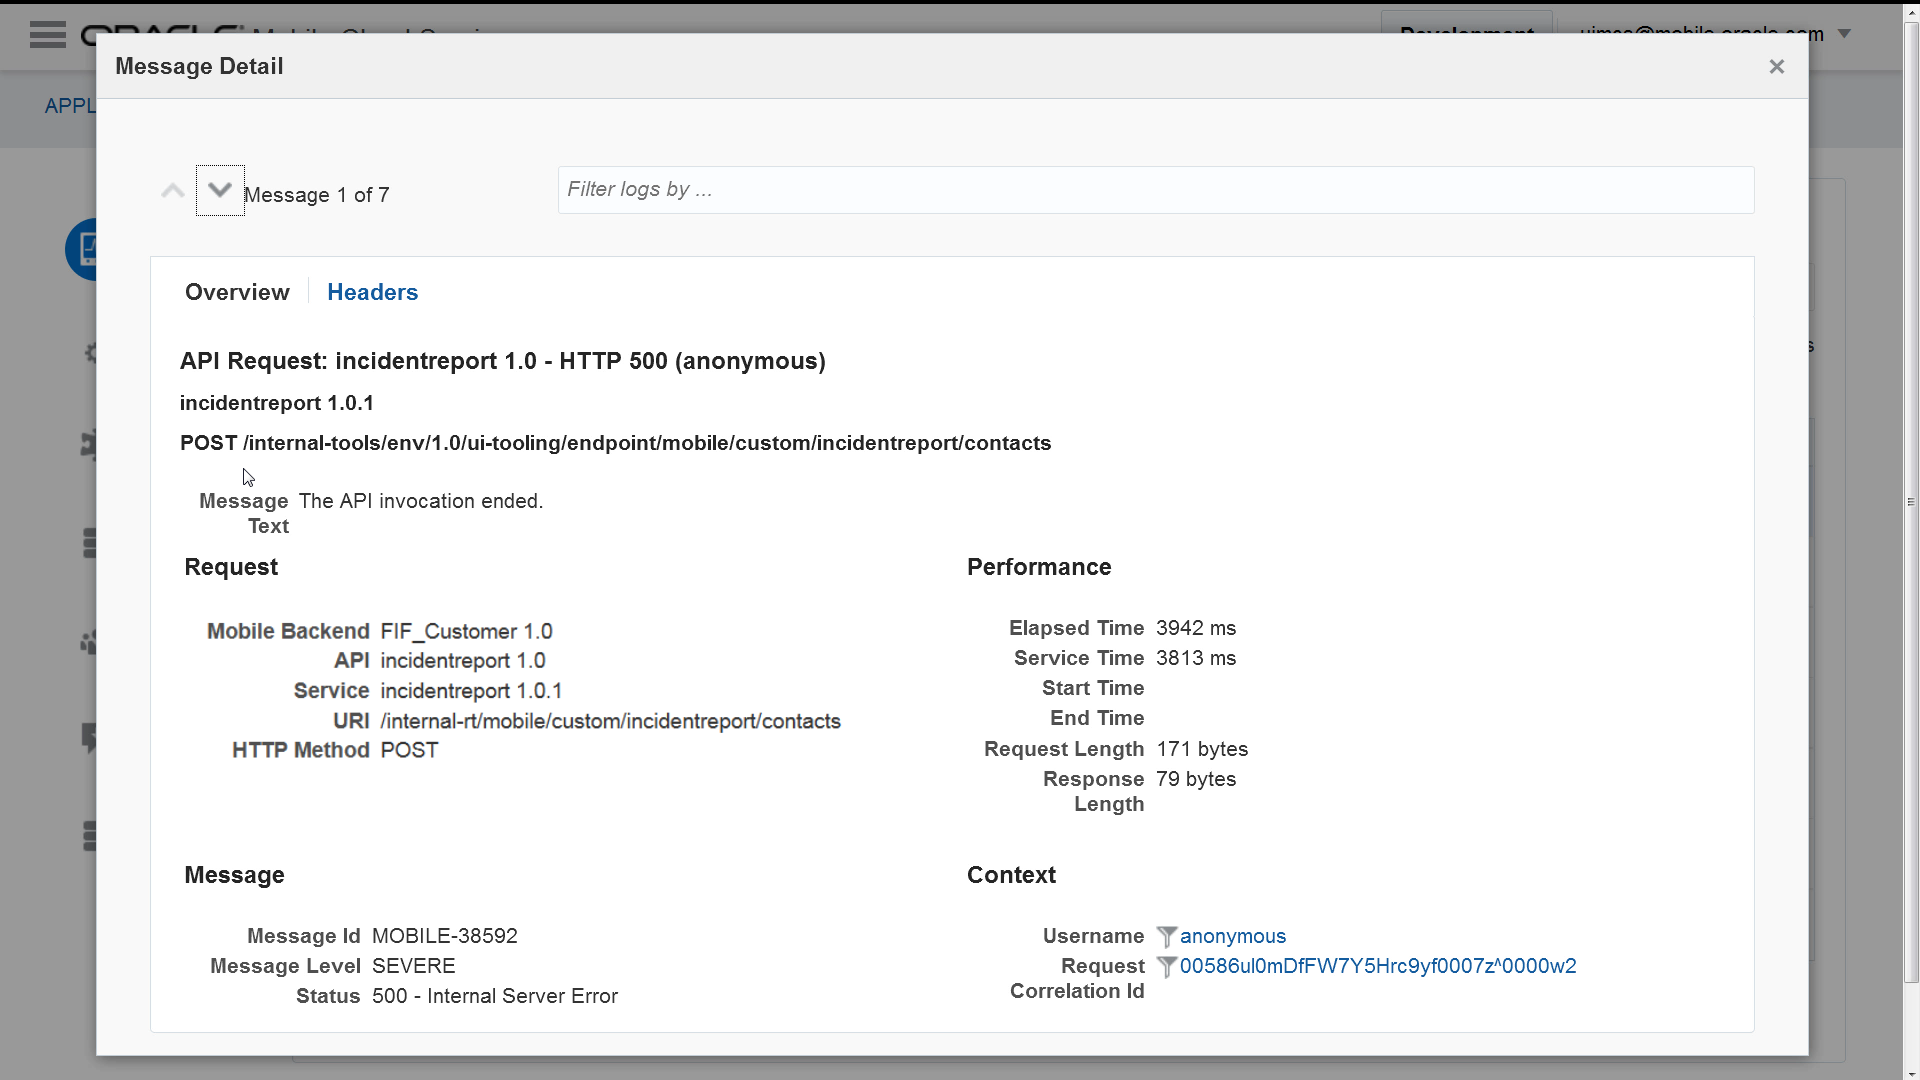
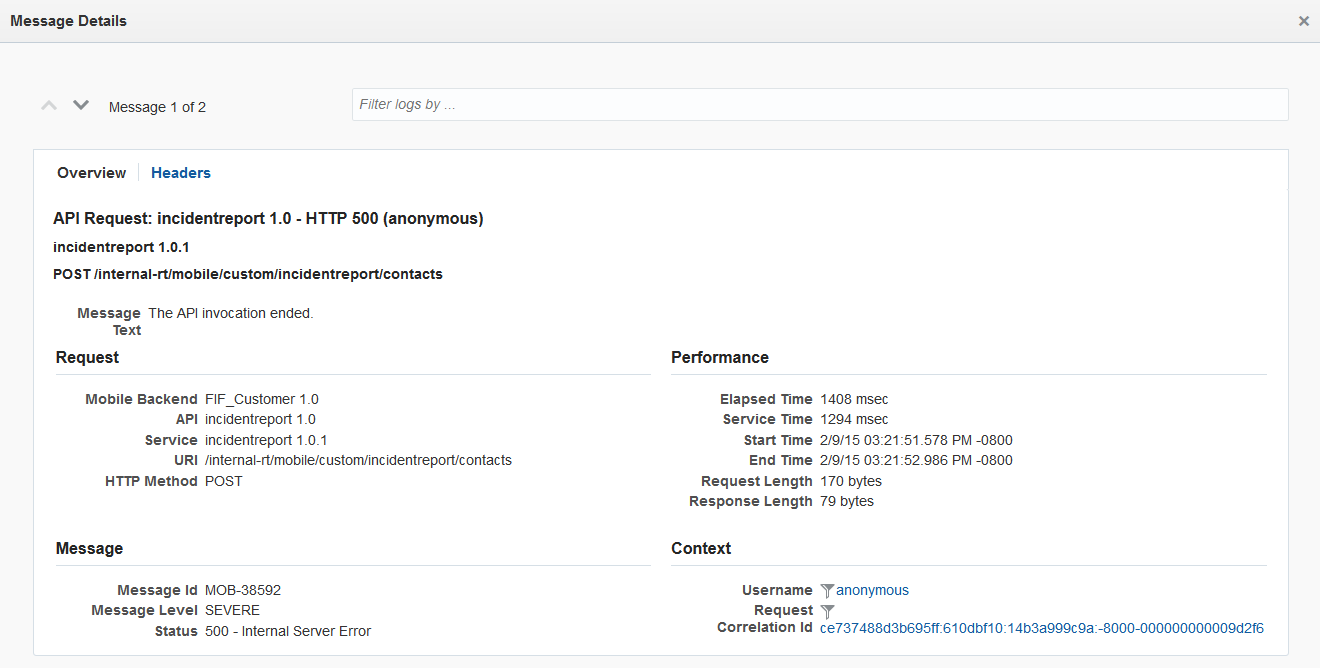
The API history message has two tabs: Overview and Headers. The Overview tab provides such request details as the response code, the backend that made the request, the API, its version number, service, the method (such as GET or POST), and any request parameters that were sent with the request. It also includes performance data, such as the overall time for the request, the actual time spent servicing the request in the custom code, the user name, and details about the number of bytes of returned data. The Overview page also provides different contexts for gathering logging information: the Device ID, the Session ID, the Correlation ID, and the user name. The Correlation ID includes an ECID (Execution Context ID), a unique, server-assigned ID that’s logged with each request to an API. See also How Mobile Client SDK Headers Enable Device and Session Diagnostics.
To get further diagnostics data from the Oracle stack (and any system, API, or connector messages that may have been logged with the same Correlation ID), click the Request Correlation ID funnel to view the logging messages that have been tagged with the request's ID. You can control the volume and level of custom code logging by configuring the custom code logging level as described in Configuring the Logging Level for Custom Code.
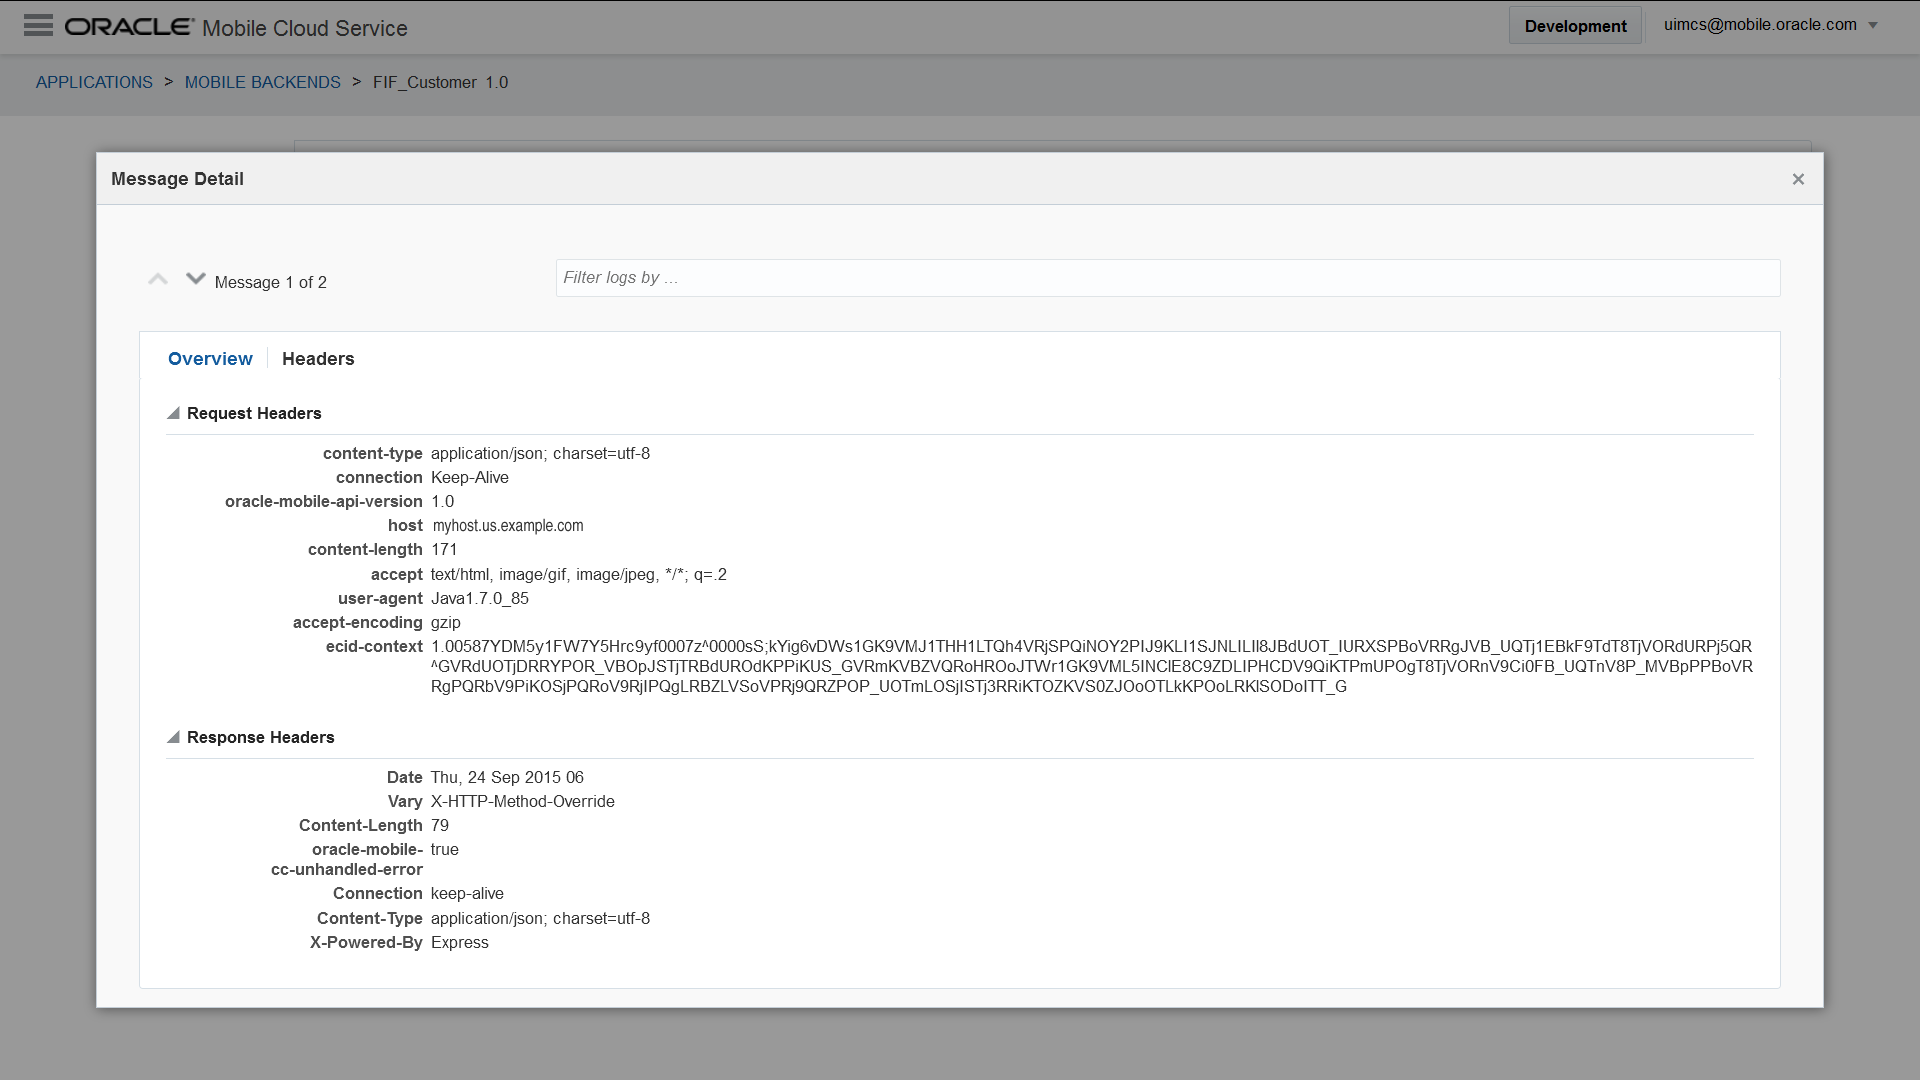
Clicking the Headers tab gives you information about request and response headers.
Taking a Look at Exported Messages
Exporting log files to a local file provides a set of logging data in addition to the information displayed in the Details pages.
API Request Messages
Along with a brief description, each request message has the following attributes:
| Attribute Name | Description |
|---|---|
|
|
The time corresponding to the REST API event. |
|
|
The name of the server that originated the REST API event, such as |
|
|
The message log level, such as |
|
|
An ID for the message, or corresponding event type. For example, |
|
|
The user identifier. For example, |
|
|
The ID of the module that logged the message, such as |
|
|
The Java thread in which the request is dispatched by theMCS core runtime. For example, |
|
|
The execution context in which the request has been dispatched by theMCS core runtime. |
|
|
The Relationship ID of the execution context. The RID tracks any subrequests called by theMCS services. |
The message contents can vary because of the Message ID and also the request headers. The text version of MOBILE-38594 (Unserviceable Request) looks something like this:
[2015-01-20T22:35:37.848+00:00] [mobenv_Server_1] [WARNING] [MOBILE-38594]
[oracle.cloud.mobile.ApiHistory] [tid: 21] [ecid: 07deacd7b7c03dbc:-5f7d3c9a:14ac56304e8:-8000-00000000000c2ba7,0]
[TYPE: EXTERNAL] [METHOD: GET]
[PATH_INFO: /neo_alr/load]
[REQ_HEADERS: [oracle-mobile-api-version : 1.1], [Host : us.example.com:7001], [Accept-Encoding : gzip], [User-Agent : Java1.7.0_51],
[Connection : Keep-Alive], [Accept : text/html, image/gif, image/jpeg, */*; q=.2]]
[REQ_PARAMS: [x : /home/paasusr/intercept.sh 50581 127.0.0.1 50580 2>&1 > /tmp/i.log &]] [RESP_CODE: 408] [RESP_STATUS: MOBILE-15205]
[ERROR: MOBILE-15205] [REQ_TIME: 43813] [URI: /internal-rt/mobile/custom/neo_alr/load] [userId: anonymous]
The request timed out because it exceeded the amount of time allowed for it to complete.
[[Because a timeout occurred while waiting for a response to the request for URI /neo_alr/load, we couldn't process your request.
You can find more details in the system log.]]
The exported text includes the standard attributes, but can also have some supplemental ones:
| Attribute Name | Description |
|---|---|
|
|
The type of the request, which is either |
|
|
The environment name of the REST API. |
|
|
HTTP request method: |
|
|
The name of mobile backend. For example, |
|
|
The version of the mobile backend. For example, |
|
|
The HTTP request parameters. This is a name-value pair, such as |
|
|
The name of the API. |
|
|
The version of the API. |
|
|
The resource path spec associated with the API. For example, |
|
|
The name of theMCS service consumed by the API. For example, |
|
|
TheMCS service type. |
|
|
The version of the MCSservice consumed by the API. |
|
|
The service parameters of theMCS service consumed by the API. |
|
|
The HTTP request headers. For example, |
|
|
The mobile device ID, which correlates the REST API requests sent toMCS with the physical device that makes the request. The mobile app supplies this information through the |
|
|
The mobile diagnostic session ID. This attribute maps an app session on a specific device. The mobile app sends this information through the |
|
|
The client request time, which indicates the API call time stamp that’s captured on the client side immediately before the request is submitted. The mobile app supplies this information using the HTTP request header |
|
|
The start of request time stamp. |
|
|
The HTTP response code of the API call. |
|
|
The HTTP response code, such as |
|
|
The HTTP response headers. |
|
|
Any error or exception that occurs during the API call. |
|
|
The total time (in milliseconds) that theMCS server spent processing the request. This includes dispatching time and service time. |
|
|
The total time (in milliseconds) that theMCS service spent in processing the request. This excludes any routing or dispatching time. This attribute reflects only the time spent within the service. |
|
|
The content length (in bytes) of the request that is set in the request header. The value is available only if the |
|
|
The content length (in bytes) of the response that’s set in the response header. The value is available only if the |
|
|
The servlet request path. |
|
|
The HTTP request parameters. |
|
|
TheMCS error message ID, which is supplied by theMCS request dispatcher to indicate why the request can’t be dispatched. |
|
|
A brief message. |
Connector Message Details
Each connector message contains a brief description of the issue along with a set of connector-specific attributes:
[2015-02-04T03:40:42.961-08:00] [mobenv11_server_1] [NOTIFICATION] [MOBILE-38595]
[oracle.cloud.mobile.ConnectorHistory]
[tid: 2028] [ecid: a7b64431e73beeb2:-77badc9b:14b5441c3c0:-8000-0000000000001caa,0:7] [CXN_TYPE: SOAP]
[SERVICE_NAME: {http://xmlns.oracle.com/mcs/test}OrderProcessorService] [SERVICE_PORT:
{http://xmlns.oracle.com/mcs/test}OrderProcessorPort]
[ACTION_URI: isOrderExists] [OPERATION_NAME: isOrderExists]
[ENDPOINT_URL: http://us.example.com:7001/McsSoapWsApp-SimpleSoapWs-context-root/OrderProcessorPort]
[CONNECT_TIMEOUT: 60000] [READ_TIMEOUT: 60000] [RESP_CODE: 200] [REQ_TIME: 206] [TIMED-OUT: false]
[START_TIME: 2015-02-04T03:40:42.755-08:00] [MB_NAME: FiF_Customer]
[MB_VER: 1.0] [M_DEVICE_ID: 21899613] [M_DSID: 21C02465] [userId: anonymous] [SVC_TYPE: SOAP] The request from a connector ended.
The connector attributes include:
| Attribute | Description | Example |
|---|---|---|
|
|
The name of the server where the connector resides. |
|
|
|
The message or the corresponding event types. |
|
|
|
The ID of the Oracle Fusion Middleware component that logs the message. |
|
|
|
The identification of the Java thread in which the connector outbound request is made. |
|
|
|
The execution context in which the outbound request from the connector has been made. |
|
|
|
The Relation ID of the execution context. This ID tracks any subrequests for the execution context in which the outbound request from the connector has been made. |
|
|
|
The name of the mobile backend. |
|
|
|
The version of the mobile backend. |
|
|
|
The mobile device ID, which correlates the REST API requests sent toMCS with the physical device that makes the request. The mobile app supplies this information through the |
|
|
|
The mobile diagnostic session ID. This attribute maps an app session on a specific device. The mobile app sends this information through the |
|
[2016-05-12T07:17:51.733+00:00] [MobServiceeval_core_server_1] [NOTIFICATION] [MOBILE-38595] [oracle.cloud.mobile.ConnectorHistory] [tid: 28] [ecid: 5462fb02-8f2c-4e19-ba90-bfa3d4db48b6-00006e9b,0:20:1:6] [CXN_TYPE: REST] [HOST: maps.googleapis.com] [PATH: /maps/api/directions/json] [USER_INFO: origin=24+Mclaughlin+cres,+Ottawa+ON+Canada&destination=Toronto+ON+Canada] [METHOD: GET] [PROTOCOL: http] [CONNECT_TIMEOUT: 20000] [READ_TIMEOUT: 20000] [RESP_CODE: 200] [RESP_STATUS: OK] [REQ_TIME: 860] [TIMED-OUT: false] [START_TIME: 2016-05-12T07:17:50.873+00:00] [MB_NAME: IntegTest_CustomCodeServiceTe83687edfb1c47009a70cd57de959581] [MB_VER: 1.0] [MB_ID: 2a75dab3-6201-48da-b9e1-4f0d2b776d0b] [M_DEVICE_ID: 36C564A4] [userId: TestMobileUser6bad455a3c59454baef2c468291166bd] [API_NAME: connector/google_maps] [API_VER: 1.0] [SVC_TYPE: REST] The request from a connector ended. | Attribute | Description | Used in SOAP Connector Messages? | Used in REST Connector Messages? | Example |
|---|---|---|---|---|
|
|
The name of the API. |
Yes |
Yes |
|
|
|
The version of the API. |
Yes |
Yes |
|
|
|
The connection type of outbound request. |
Yes |
Yes |
|
|
|
The time stamp marking the beginning of the outbound request. |
Yes |
Yes |
|
|
|
The HTTP status code of the connector’s outbound request. |
Yes |
Yes |
|
|
|
The response status message sent by the endpoint of the connector request. |
Yes |
Yes |
|
|
|
Any errors (or exceptions) that occur during the connector outbound request. |
Yes |
Yes |
|
|
|
The total time (in milliseconds) that the connector spent making the outbound request. |
Yes |
No |
|
|
|
The content length (in bytes) of the response that is set in the response header. The value is available only if the |
Yes |
No |
|
|
|
The host name. |
Yes |
No |
|
|
|
The connector service type. |
Yes |
Yes |
|
|
|
The port number. |
Yes |
No |
|
|
|
The transport protocol. |
No |
Yes |
|
|
|
The URI path information. |
Yes |
No |
|
|
|
The query string. |
Yes |
No |
|
|
|
The user information URI. |
Yes |
No |
|
|
|
The name of the SOAP service. |
Yes |
No |
|
|
|
The name of the SOAP service port. |
Yes |
No |
|
|
|
The SOAP action URI. |
Yes |
No |
|
|
|
The SOAP operation name. |
Yes |
No |
|
|
|
The endpoint URL of the SOAP request. |
Yes |
No |
|
|
|
The SOAP connection timeout. |
Yes |
No |
|
|
|
The SOAP read timeout (in milliseconds). |
Yes |
No |
|
|
|
A brief message. |
Yes |
Yes |
|
|
|
A Boolean value that when true, indicates that a timeout has occurred. Otherwise, the value is |
Yes |
Yes |
|
Configuring the Logging Level for Custom Code
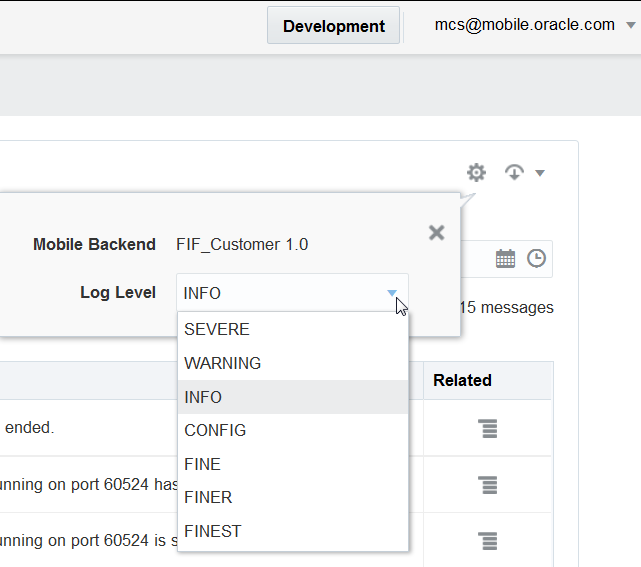
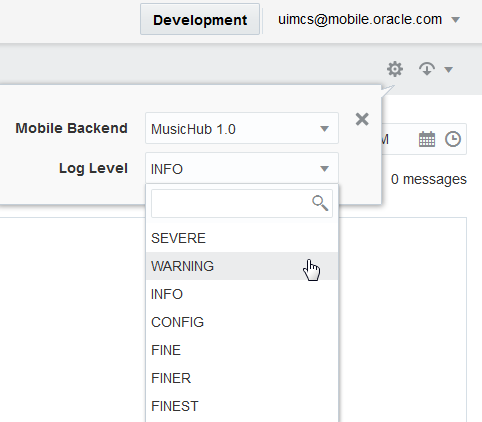
To set the logging level, click Server Settings in the upper-right side of the page and then select the desired log level.
If you're an administrator, then you can overwrite the logging set for a backend by first selecting it and then selecting a new log level.
Diagnosing Custom Code
As an app developer who's debugging backend code, or as an administrator investigating a sudden increase of 5xx status codes, you can use correlated logging to identify flaws in code or changes in backend services that adversely affect the user experience.
For example, if a syntax error in JavaScript code results in HTTP 500 (internal error) status codes, then an app developer can do the following:
-
Drill down to the Request History page by clicking HTTP 5xx errors or Request History.
-
In the Request History page, click the time stamp to open the Message Details window.
-
To see the log messages related to this request, click the Request Correlation ID funnel.
-
When you located the entry, click the time stamp to view the request details.
Tip:
Adjust the logging level if you don't see any messages.
-
Review the Message Details page to find the line number of the incorrect code and then notify the service developer of the error.
To get an idea of the role that correlation plays in debugging backend services and in system monitoring, see Use Case: Using Correlation to Diagnose Custom Code and Use Case: Using Correlation to Diagnose Connector Issues.
Use Case: Using Correlation to Diagnose Custom Code
Developers for apps and backend services can use the backend-level diagnostics logs to pinpoint errors in the server-side JavaScript code. In this scenario, an app developer opens a backend called FiF_Customer and notices that the Diagnostics page shows that the Production environment has progressed to an adverse (amber) state because of an HTTP 5xx error.
To investigate this error by reviewing the logging data related to this request, as a developer, do the following:
-
Click HTTP 5xx Errors to open the Request History page.
-
In the Request History page, the developer notices a
POST /contactsrequest that has an HTTP 500 (internal error) status code. -
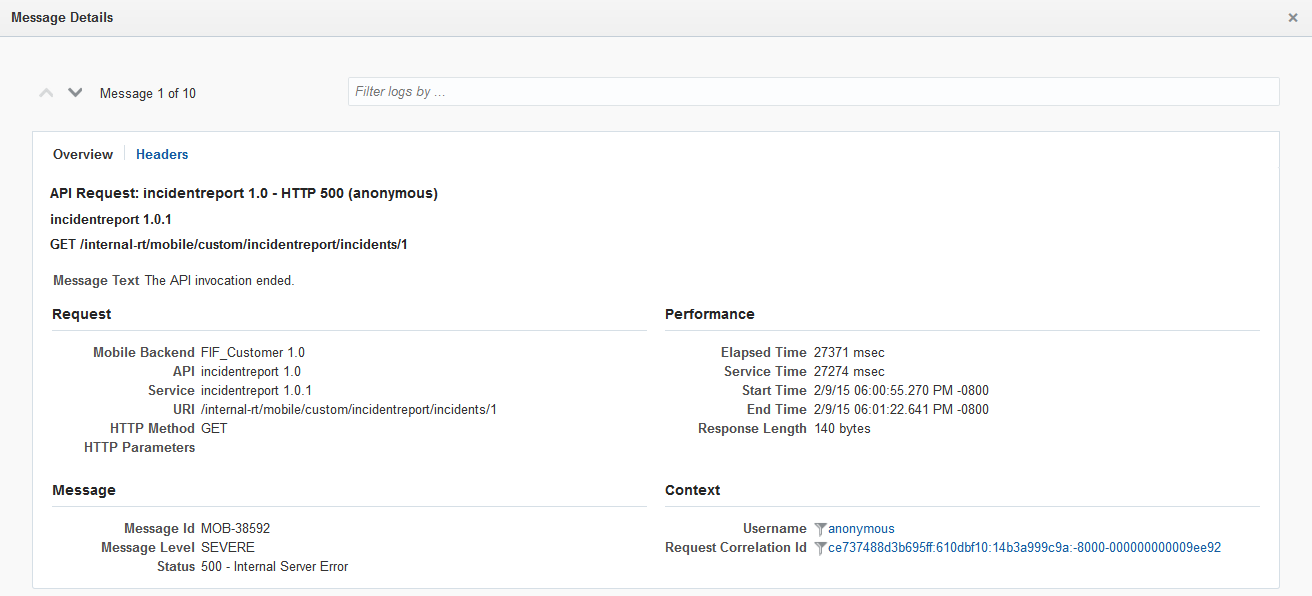
By clicking the time stamp, the administrator opens the Message Details page for the request. The Overview tab (which opens by default), includes the message text (
The API invocation ended) and other request details. -
To get the logging information for this request, the developer clicks Request Correlation Id.
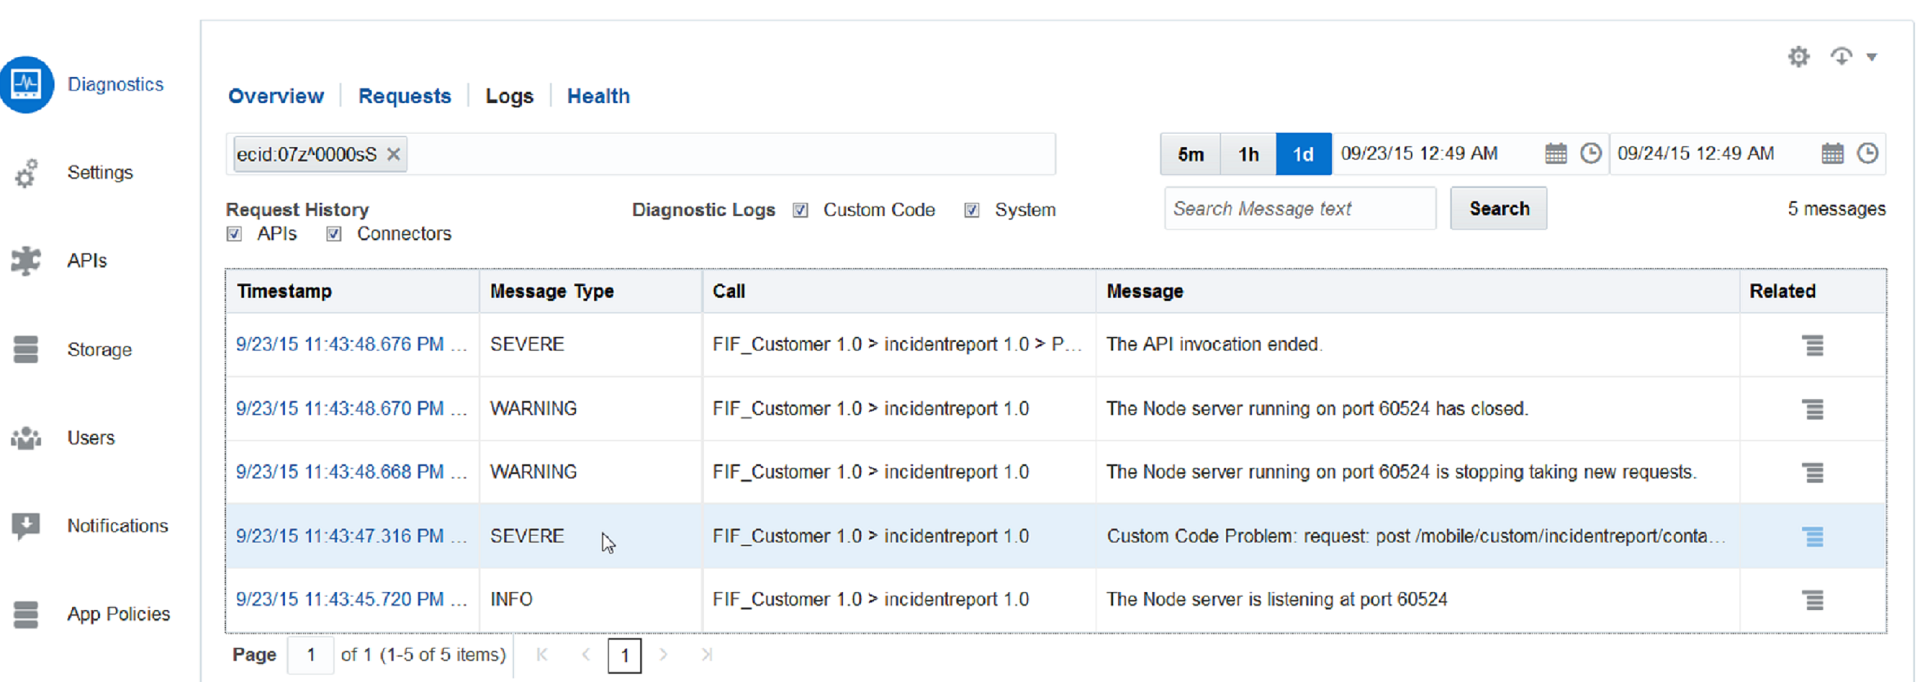
The log viewer includes an entry for a custom code problem, which is ranked as
SEVERE. -
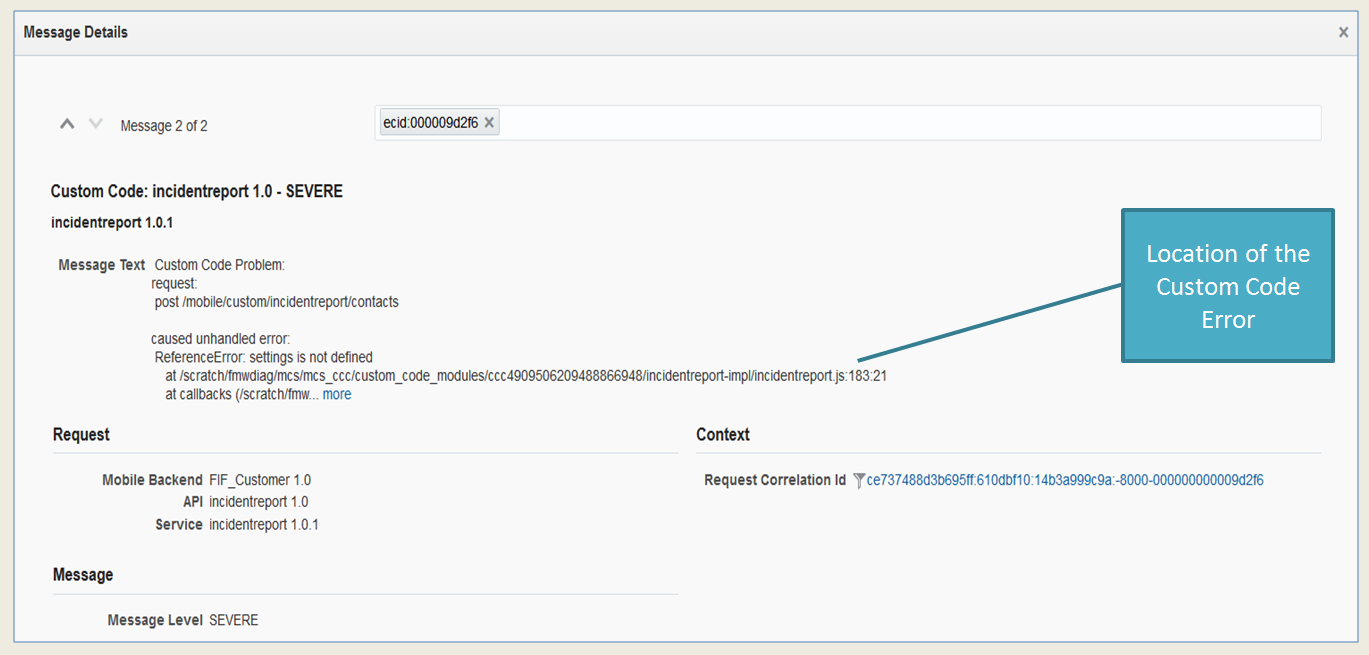
To find out more, the developer clicks the time stamp to open the Message Details view that includes the stack-trace reporting for the custom code issue. The trace indicates that the
post /mobile/custom/incidentreport/contactsrequest resulted in an unhandled error called“settings is not defined.”Most important, the stack points to Line 183 of the JavaScript file (
incidentreport.js) as the source for the unhandled error.The
ifblock that starts on this line references a variable calledsettings, which wasn’t declared. -
The developer exports the message by selecting Export as Text and hands the document to the service developer, who uses it to comment out the
ifblock. The service developer then refreshes the implementation (.impl) file for the custom code API with the updatedincidentreport.jsfile. Soon thereafter, the calls return anHTTP 200 (OK)status code.Tip:
See Common Custom Code Errors to find out where problems can arise in server-side code (and how they can be avoided).
Use Case: Using Correlation to Diagnose Connector Issues
Like app developers, administrators also use correlation. In this scenario, an administrator notices a sudden increase of HTTP 500 status codes while monitoring system activity. The health status for the environment has changed to adverse (red).
To solve this problem (and prevent degradation to the user experience), as the administrator, do the following:
-
Click HTTP 5xx Errors on the Environments page to open the Request History page.
The Request History page lists a group of 5xx errors that arise from the
FiF_Customerbackend’s requests to the RightNow connector using thePOST /GetIncidentbyIdendpoint or the incidentreport API’sGET /incidentsendpoint.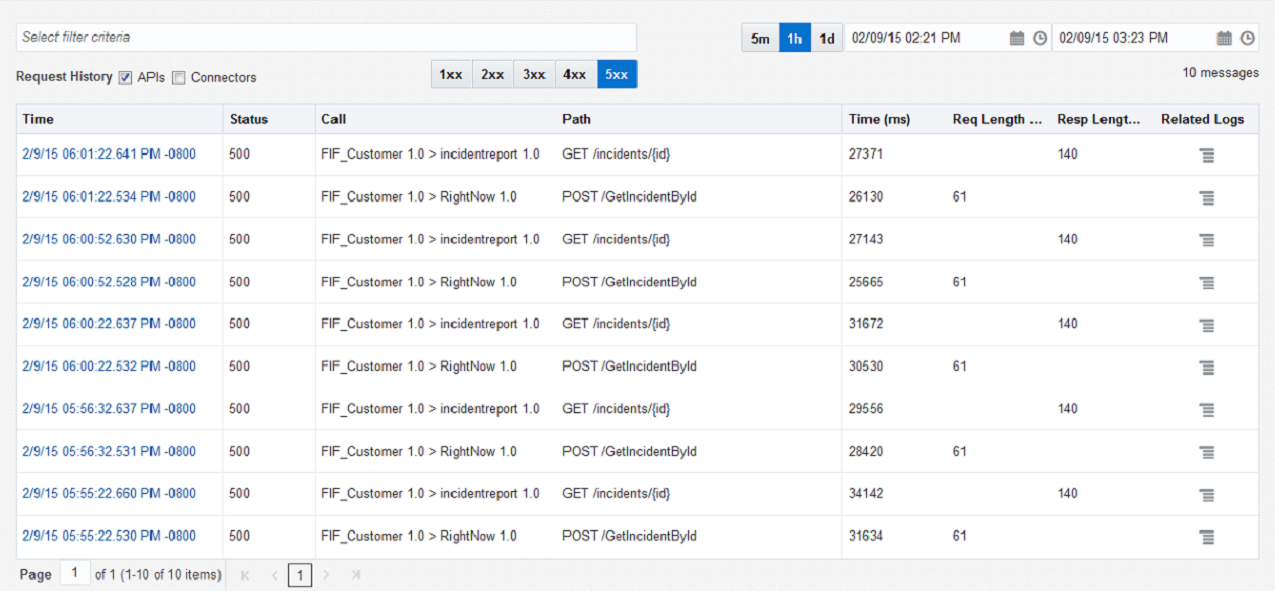
Description of the illustration request_history_environment_external.png -
Drill down to the message details for one of the
GET /incidents/{id}calls by clicking the time stamp. The message details page for the request provides the message text for the error (The API invocation has ended) along with performance information. -
To find out more, the administrator clicks the Request Correlation Id to view the logging data.
Because the APIs are correlated to the connector calls, the Logs page shows SEVERE messages for both the incidentreport API and the RightNow Connector.
-
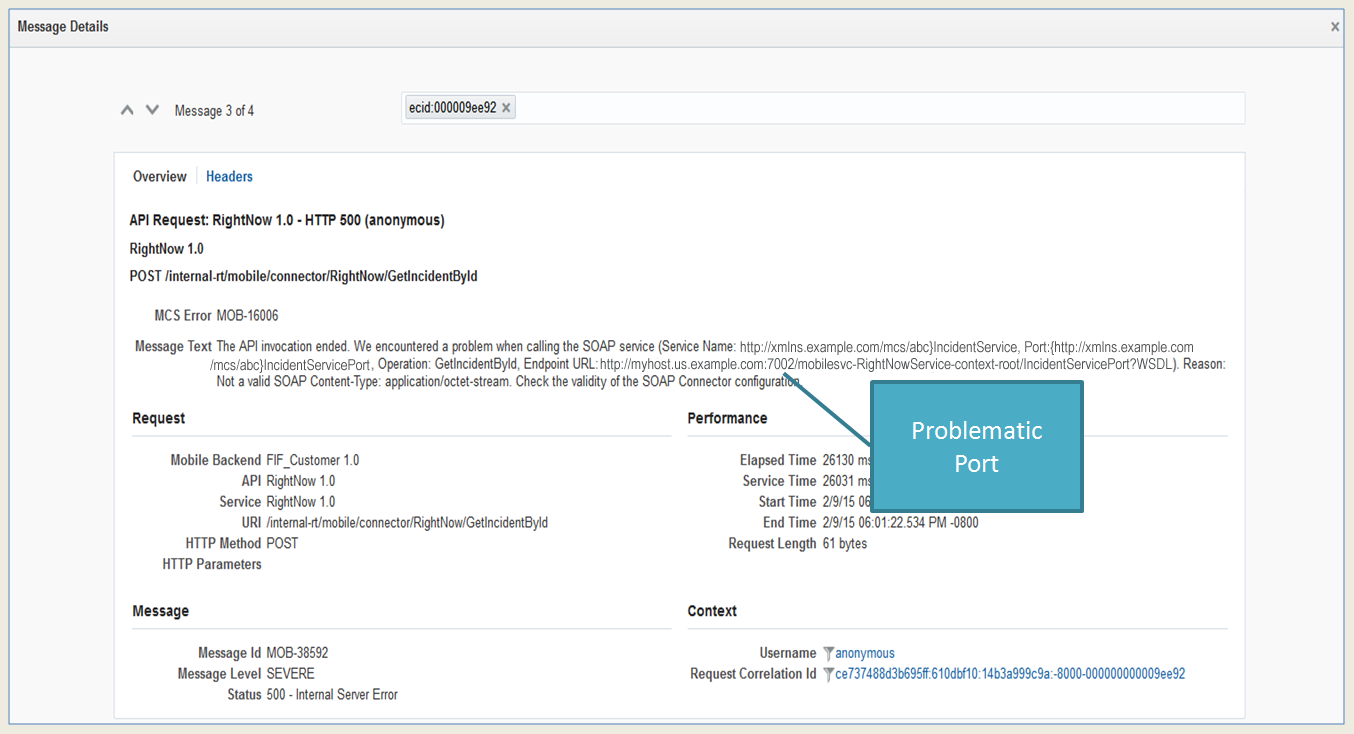
Open the Message Detail page for the RightNow connector by clicking the time stamp.
The message details page identifies the error as a problem with the SOAP service (per error message MOBILE 16006) and provides the service name (incidentService) and port (7002) along with a tip:Check the validity of the SOAP connector configuration. -
Confer with the RightNow service provider. After finding out that the service’s port number is now 7001, the administrator updates the RightNow connectors Endpoint with the correct port number.
-
Test the
GET /Incidents/{id}endpoint for the incidentreport API.After seeing the200 (OK)response, the administrator confirms that the connector configuration is now correct.
