4 Funnels
Conversion funnels let you compare how many users start a workflow (say, a checkout process, a user registration process, or a lead generation) against how many actually complete it. A funnel segments a workflow into a sequence of steps designed to guide users to some goal (or conversion). Typically, users drop off at each step of a workflow; many may begin a checkout process, for example, but comparatively few complete it. Funnels show you the conversion rate for a workflow by showing the number of users who drop off at various points.
What Are My Conversion Rates?
Funnels are indispensable for surfacing your conversion rates by showing you how many users complete an ordered series of events toward a conversion goal. For most businesses, a conversion goal is often made purchase, but it could be something else, like signed up for a subscription or gave a donation. Funnels start out broad then progressively narrow as users drop off at each event. For example, more users may browse a catalog than put an item in a cart, but fewer still actually purchase it. Funnels are great for understanding where users lose interest so you can improve a process to increase conversion or get rid of inefficiencies that are causing users to leave your app.
Funnels help you answer questions like:
-
Do users who convert follow a common path through events?
-
Are users moving through a series of events in an expected amount of time?
-
Is the latest campaign attracting more new users to the app?
-
What percentage of users checkout with coupon codes?
-
Is there a common event that causes users to drop off before checking out?
What Kinds of Things Can I Do with Funnels?
Depending on your line of business, use funnels to see:
-
The percentage of users using the free version of your app who go on to purchase a paid subscription. Low conversions could help you decide if your free app needs a redesign.
-
How many users pinning your products on Pinterest go on to purchase them. High numbers show you it’s a great ROI to build a strong presence on the site.
-
Whether viewing product How-To videos results in fewer calls to customer service. If call numbers are high, might be time to retool the content of those videos.
-
If number of ads viewed vs. number of recommendations on social media result in more sales. If ad view revenues are low, best move those marketing dollars elsewhere.
Funnel Reports: Try This First
Funnels are used to track a user’s progression through events to discover why some users complete the events, and others don’t. To create a funnel, you choose events in a logical sequence. Here’s how to do it:
-
Click the Application menu and choose the Easy Shopping app.
-
From the side menu, click Funnels.
-
Click New Funnel.
-
In the Name field, add a name for your funnel.
-
In the Date Range field, click the calendar icon to choose a From and To date range.
-
In the Step 1 field, click the down arrow to select the event Catalog Browsed from the list.
-
In the Step 2 field, click the down arrow to select the event Add To Cart from the list.
-
Click Add Step.
-
In the Step 3 field, click the down arrow to select the event Checkout from the list.
-
Click Run Report.
The funnel report you created is shown. Funnels are a super useful way to gain insight into the things users do who convert, so you can encourage the same behavior in users who don’t. Conversely, you can see what users who don’t convert are doing, and use your insights to change your app or engage at critical junctures to get users through the funnel. Let’s take a closer look at the details.
Example: Creating a Funnel from the Funnels Category
Suppose you launched a re-engagement campaign for your Easy Shopping app in which non-active users received a text from your company. Now you want to measure the effectiveness of the campaign to see if it increased sales in certain stores that carry your products. To do this, you create a three-step funnel to understand 1) who opened the text, 2) who clicked on the linked URL to get the promotion, and 3) who used the promotion. When you get the results, you can filter the data by location to see the top three stores with the greatest sales lift. Then save the results of the funnel as a segment so you can use it later.
To create the funnel:
-
Click Funnels on the side menu.
-
Click New Funnel. (You may need to click All Funnels first.)
-
In the left panel, add a name for the funnel.
-
Set the date range. (Unlike other reports, a funnel must have a specific date range).
-
Add a description of the funnel, if you’d like.
-
Click the box for Maximum Time to Complete, then click the arrows to select how long users have to complete all the steps in the funnel to be counted as part of this user group.
-
Click the box for the Completion Goal, then use the slider to specify the percentage that you would consider a success (or failure, if that’s what you’re targeting).
-
In the main panel, for the first step click Campaign viewed from the drop-down list.
-
For the second step, choose Campaign clicked.
-
Click Add Step, and for the third step, choose Checkout. While funnels can have as many steps as you want, they typically don’t have more than three.
-
Click Run Report.
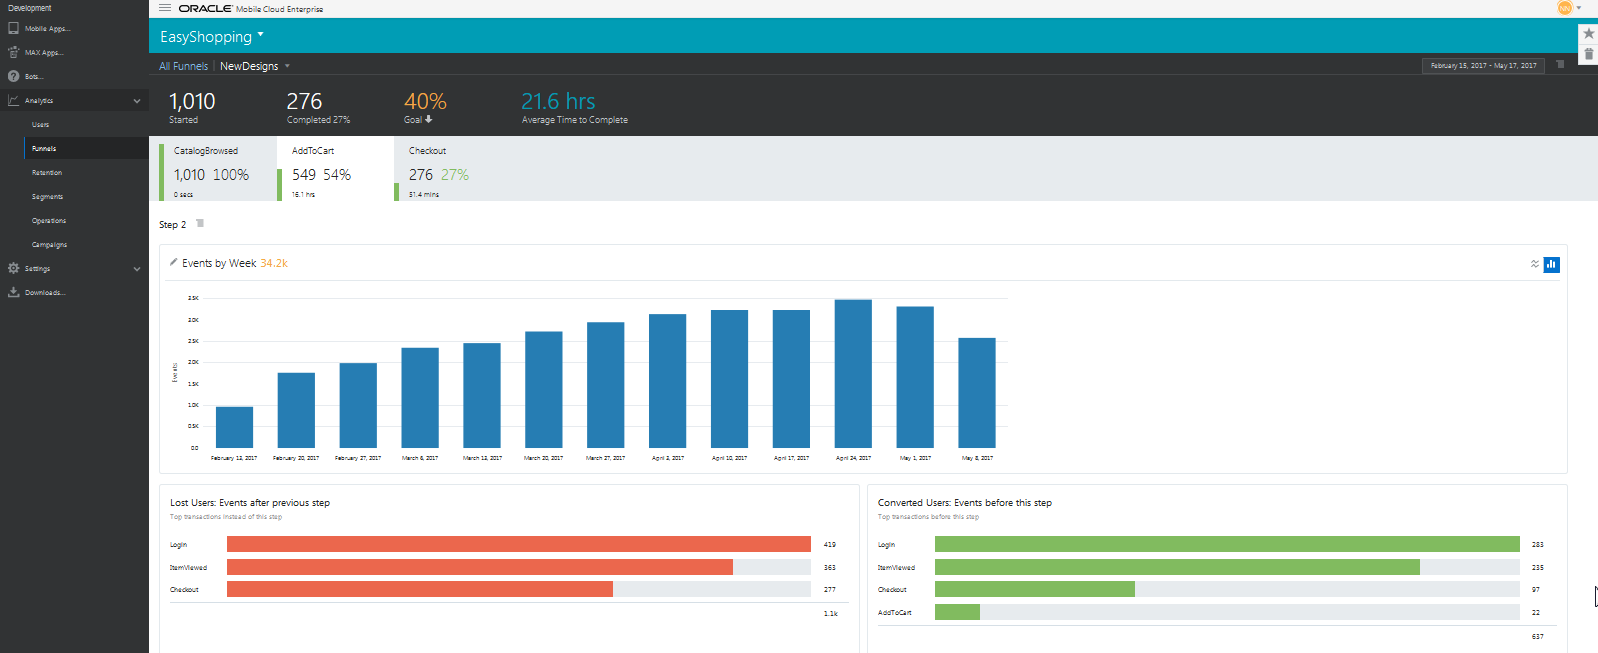
The funnel report should look something like this:

Description of the illustration funnel-report-tour-2.png
-
For each funnel step, you can see the number and the percent of users who converted, that is, who met the goal you set, which in this case is Checkout.
-
Click any of the steps in the second row to see its data displayed in a chart. You can also click the pencil icon to update the Measure, Dimension, and Grouped By fields to explore the data more fully.
-
At the bottom of the chart, Lost Users shows you what users did instead of the current step you’re viewing. That is, the chart shows that instead of logging into the app (which is the step shown in this example), the top transaction users did was simply to launch the app. In other scenarios, Lost Users information can be much more helpful. For example, you might discover that when users come to the screen that asks for personal data, they drop off. This could mean you need to redesign your app so that screen comes later, or maybe you only ask for an email address instead of a phone number.
-
Of the users who successfully completed all the funnel steps, Converted Users shows you what other behaviors those users did before the current step you’re viewing. You may want to know this to send targeted campaigns to Lost Users to get them to engage in the same behaviors as the Converted Users. Like, suppose you find out that Converted Users often view content on your Facebook page before purchasing. You can devise a campaign to encourage Lost Users to visit your page for a special discount for first time viewers, then see how that impacts sales.
How Filters Work in a Funnel Report
If a global filter is selected, it determines who enters the funnel, for example new users from San Francisco. Every step can also have its own local filter, which identifies the users who complete that step. Let’s look at how global and local filters would work in a funnel with three steps:
-
The global filter is set to select only new users in San Francisco over the last 30 days. This limits the number of users that enter the funnel to 1000, from a possible number of 25,000 overall users.
-
Using a local filter for Technology, Step 1 checks which of the San Francisco users browse your catalog on iOS devices. This narrows the number to 600 users.
-
Step 2 checks who of the 600 users also put an item in a cart. Now we’re down to 200 users.
-
Using another local filter for Technology, Step 3 checks who of the 200 users checked out using a tablet. In our scenario, the final result is 75 users.
Using Funnels Effectively
It’s often useful to take an iterative approach to funnel analysis. Deploy your app long enough to collect a significant amount of data, then make changes to your app depending on what you find out from your data. Redeploy and set up a second funnel analysis, tweak the app, and so on, with each refinement getting you closer to your business goals.
Creating a Segment from a Funnel Report
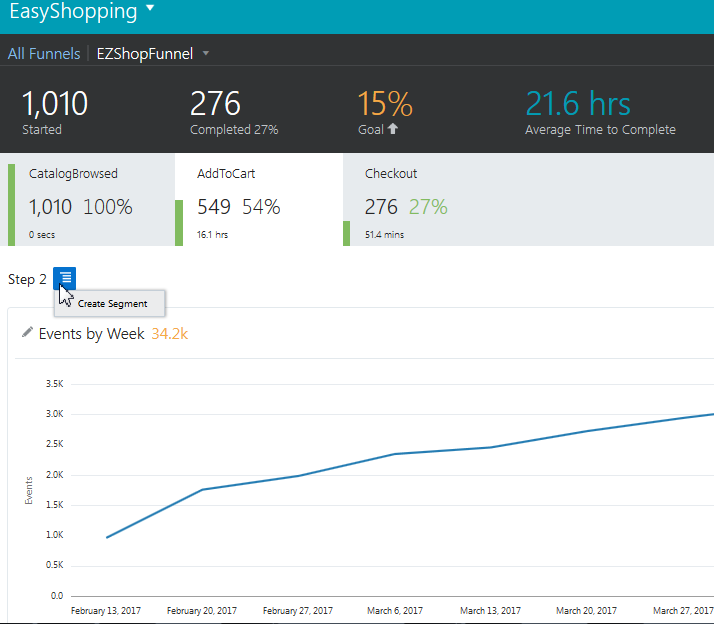
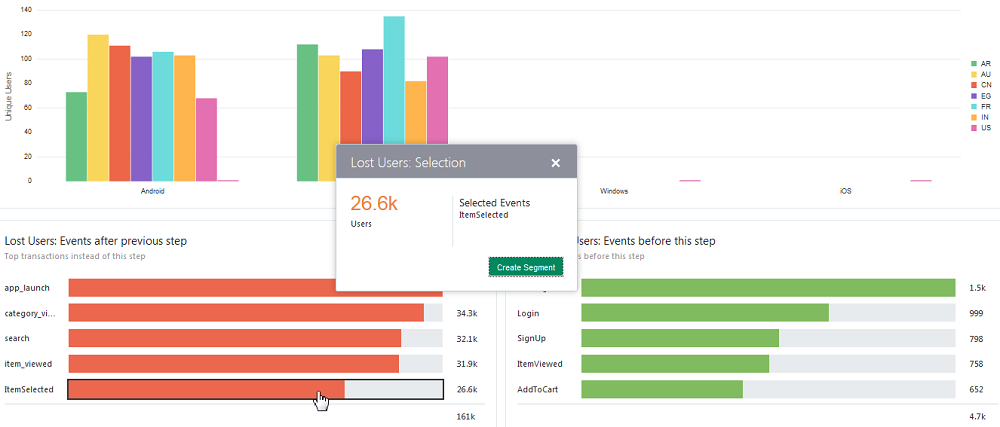
To create a segment from a funnel report, click any step on the top of the report and click Create segment. You can also click one or more bars in the Lost Users or Converted Users graphs. To select multiple bars, use CTRL + click. The more bars you click, the more users you add to the segment. You can click a bar again to deselect it.
When you’ve selected the users that you want in the segment from either the steps or the charts , click Create Segment. Your segment is now accessible from the Segments filter, as well as from Segments on the side menu. You can apply the segment as a filter in user and retention reports, combine it with other segments to create a new segment, or use it in a campaign for targeted messages.

TIP: While creating a segment of users who converted is useful, it’s only half of the story. You may also want to target those users who did not convert. Just click on the users of interest in the Lost Users chart, and save it as a segment for a campaign.
Using the Funnels Actions Menu
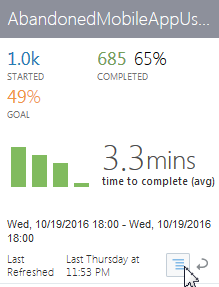
Use the Actions menu to edit a funnel, make it a favorite, run the report, or move it to the trash.

Here are some things to know:
-
When you create a funnel report, it’s saved to the funnels landing page. (You can always get to the funnels landing page by clicking Funnels from the side menu, then All Funnels).
-
On the funnels landing page, use the Actions menu to add a funnel report as a favorite. Once a report is a favorite, anyone can access it from the Favorites drawer.
-
Use the Actions menu to send a funnel report to the trash. You can also recover it by clicking the trash can icon on the Trash drawer.
-
You cannot maximize a tile from the funnels landing page. If you’d like to see a funnel’s chart in a maximized view, as well as the Lost and Converted Users charts, you have to choose Run Report from the Actions menu.