3 Users
User and sessions reports give you the foundation from which you learn about your users. Find out who your active users are, who’s on the fence, who’s dropped off, and the reasons behind these actions. From here you can save user segments and apply them to other reports, or use them in targeted campaigns with the integrated Campaign tool.
Who’s Using My App?
User and sessions reports give you a deep look into who’s using your app, and how often users return. You can add filters to help you see such things as where your users are located, whether they’re a new or returning user, what time of the day they usually open your app, and if they cash in coupons you send. You can even drill down to learn, say, what model of device they’re using, or how many sessions they’ve had in your app.
A session is the time between when a user opens and closes the app, or it times out. Session interval is a related metric that shows you the time between the user’s first session and other sessions, telling you how often users are in your app. This information could indicate how valuable your app is and how engaged your users are. Long lag times in session intervals could mean your app design needs a refresh or your content could be more compelling.
User and session reports help you answer questions like:
-
What are my overall user demographics?
-
What are the demographics of my highest value users?
-
Do users in a particular location buy certain products more often?
-
How many new users have I had over the last week, month, and year?
-
Which users are the most and least active?
-
What is the average session length, and average time to the next session?
With insight into users and sessions, you can keep users coming back with content and incentives that meet their needs, as you find new ways to build user loyalty.
What Kinds of Things Can I Do with Users and Sessions?
-
Choose a filter for Sessions to find out which users are most active. Save this user group as a segment and use it in a campaign to get these users to like your app in the App Store or Google Play.
-
Filter by location and zip code to find out where the greatest number of active app users is concentrated. Save this as a segment and use it in a campaign letting these users know your products are also available in nearby stores.
-
Run an analysis to find users who have become inactive in the last three months. Save this group as a segment and use it in a “miss you” campaign offering a 30% off coupon.
-
Use New Users and Average Time to Second Session to analyze if a campaign offering new users a limited time only discount gets them back in the app faster. If so, you’ve confirmed that’s a promo you want to keep.
User and Sessions Reports: Try This First
User and sessions reports give you insight into your users. With a few clicks, let’s walk through a preview of how to use filters to create User and Sessions reports.
-
Click the down arrow next to the Application menu and choose an app.
-
From the side menu, click Users.
-
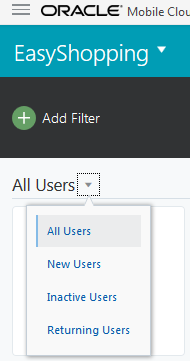
Click the down arrow next to All Users and choose a user type.
-
Click the global filter icon, then click Add Filter.
-
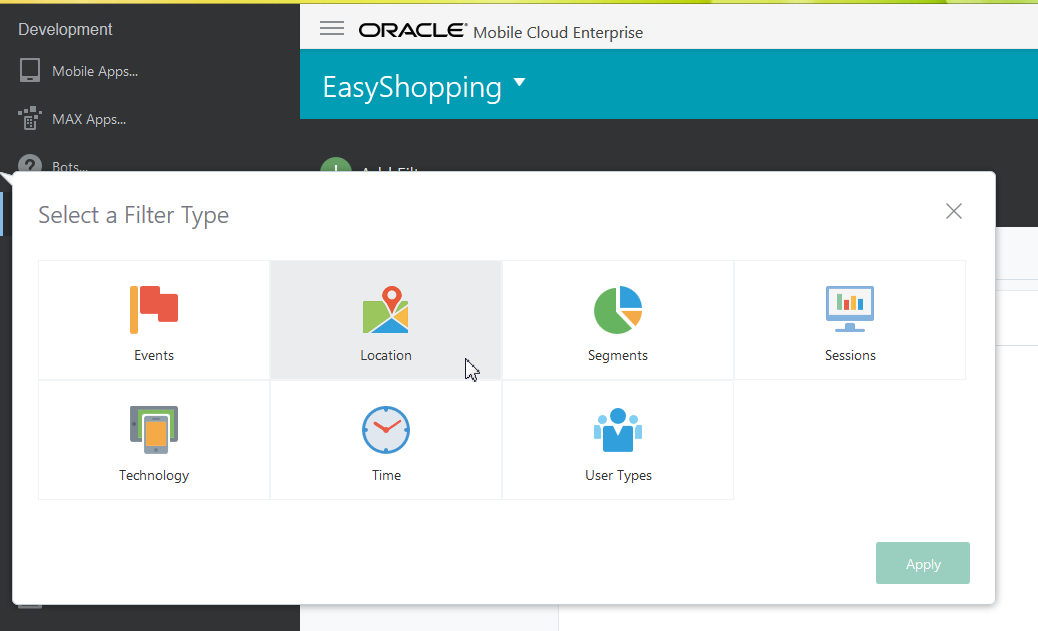
Click on a filter type, then choose a filter property from the list in the left panel.
-
Continue to add other filters you’re interested in by clicking the plus icon, then click Apply.
The Users landing page now includes the reports you’ve created. Use the filters to create more reports to dive deep into who’s using your app, where they’re located, how often they come back, and other insights into who your customers and clients are. Let’s take a look at the Easy Shopping app and use it to discover more about your users.
Choosing a User Type to Analyze
| User Type | Description |
|---|---|
|
New User |
A user on their first visit to the app during the measurement interval. |
|
Returning User |
A user with two or more visits to the app during the measurement interval. |
|
Active User |
Users who are New or Returning during the measurement interval. |
|
Inactive User |
A user with zero visits to the app during the measurement interval. |
Each user can only belong to one of these categories at any point in time (however, new users and returning users are grouped together as Active users when selecting from the Users filters). So, if Ty logged into your app once three days ago, he is considered a new user. Likewise, if Emma logged into your app yesterday and again today, her status moves from new user to returning user. If either user shows no activity during the analysis time period, they become an inactive user.
Example: Creating a Users Report from the Users Category
Let’s say you’d like to find out about a particular group: All your users in California from the last year. You want narrow this group to Android users, and also find out how much time they’re spending in your app. All of this data will help you connect with these users you think are likely buyers of your new sports team Android accessories available through your Easy Shopping app. With these goals in mind, let’s see how you can create a Users report.
To create a user report:
-
Click the down arrow next to New Users to change to All Users.
-
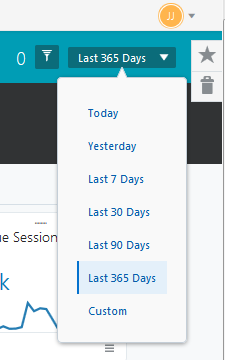
Click the down arrow in the global date selector and choose Last 365 days.
-
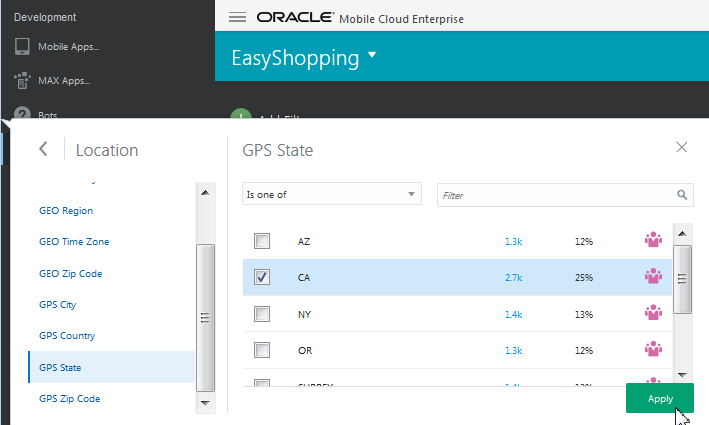
Click, Add Filter then click Location.
-
In the left panel, click GPS State.
-
In the drop down menu, click the down arrow and choose Is one of for the first criteria. Then click in the box for California and click Apply.
-
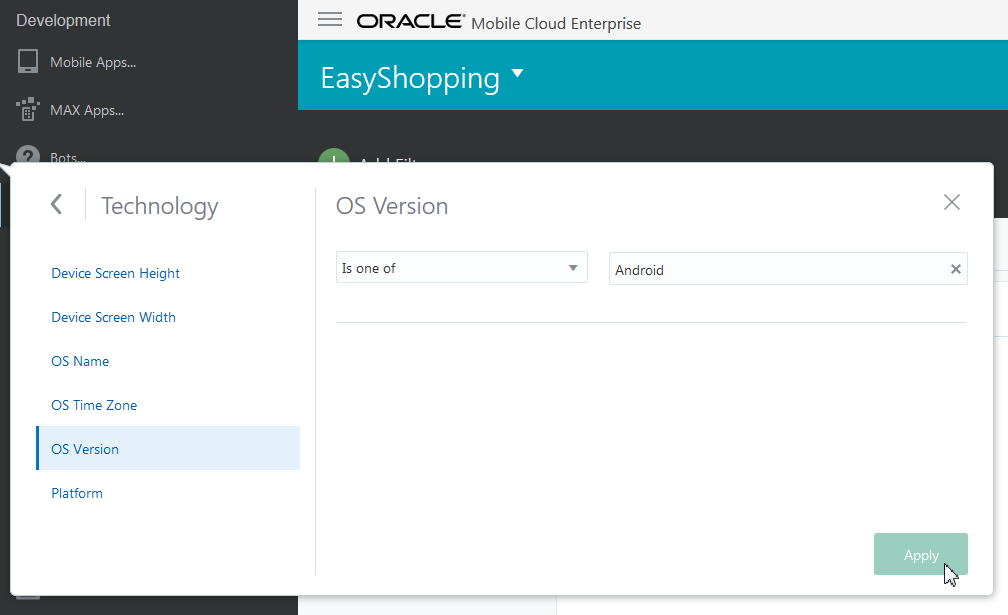
Click Add Filter, and choose Technology.
-
In the left panel, click OS Version.
-
In the drop down menu in the main panel, click the down arrow and choose Is one of for the first criteria. Then choose Android for the second criteria and click Apply.
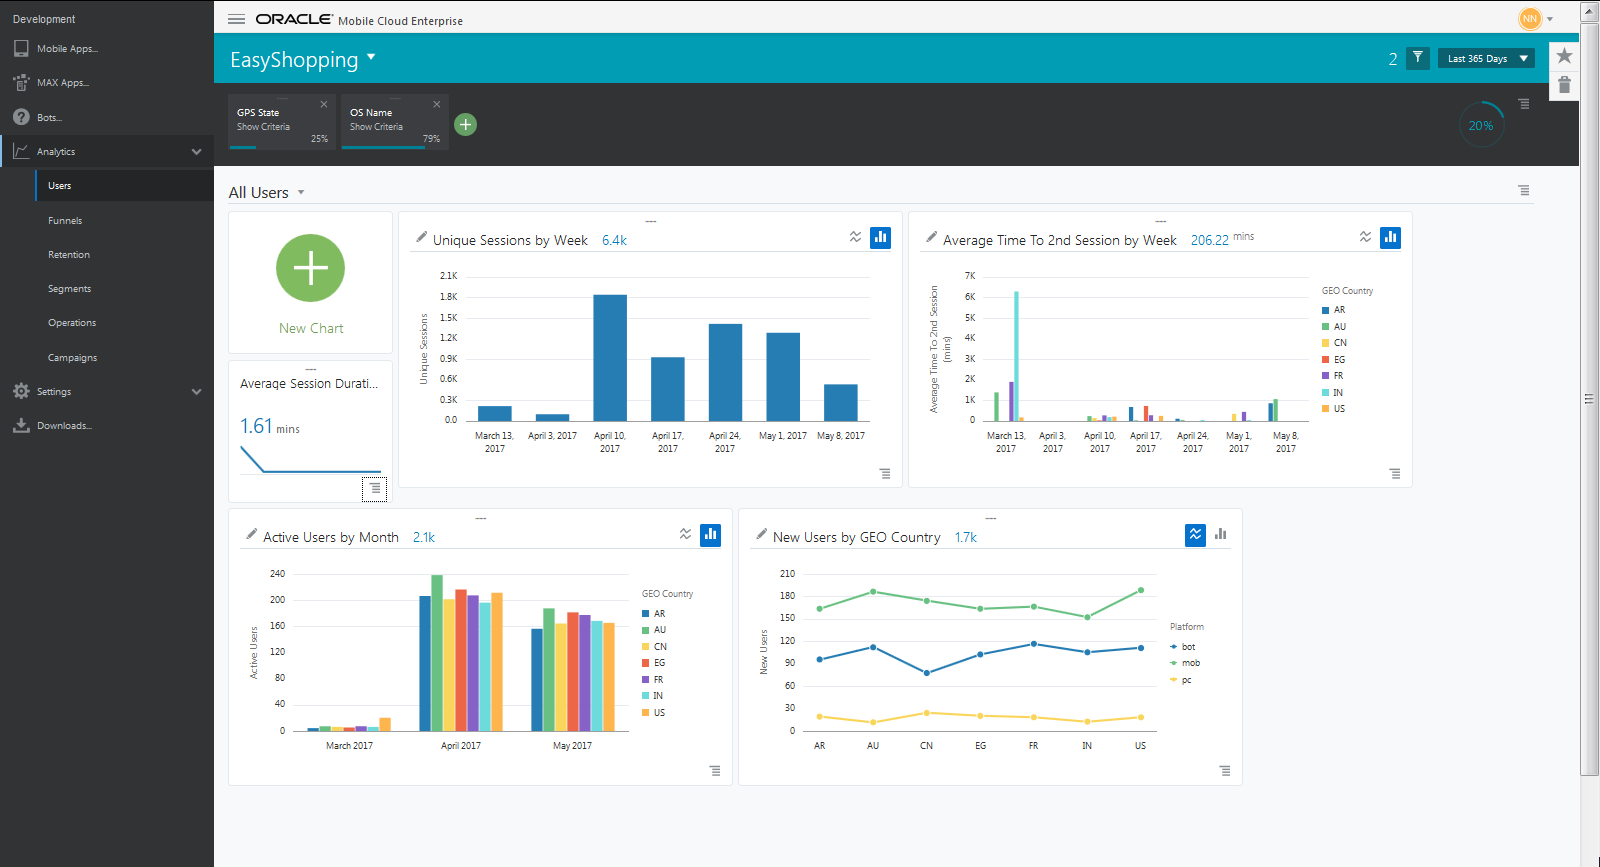
The Users report should look something like this:
Here’s a look at the user report results:
-
The top row shows the filter summary area. This lists the report filters, a summary of their criteria, and results for the time period you chose. If there are multiple filters, it also shows whether the filters are connected by an AND or OR relationship. At the end of this row is a graphic showing the percentage of users matching the filters.
-
The default filters provided with Analytics show sessions information based on a user’s app usage history.
-
Click on the Options menu on any tile to maximize it. From there, click on bars or lines on charts to drill down for more insights.
- Click New Chart to make a copy of a default chart. The New Chart feature is useful if you want to change the measure, dimension, or grouped by options and take advantage of the flexibility of Analytics. See Configuring the Charts on Tiles
Creating a Segment from a User Report
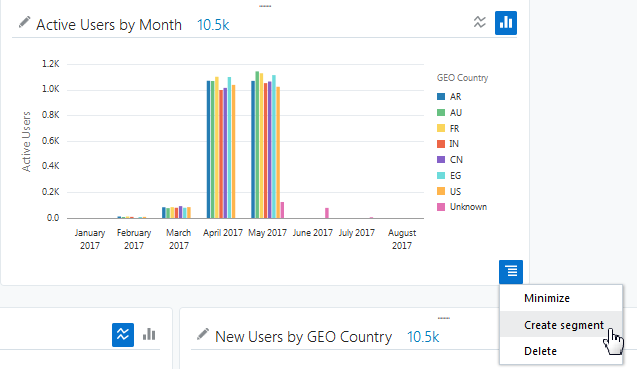
Segmenting users is the process of dividing potential customers into groups based on characteristics like age, location, or purchasing behaviour. To create a segment from a user report, click the Options menu , and click Create Segment. This choice is available in the tiles where users-related measures, such as unique users or active users, are chosen. If the measure is anything other than users related (for example, average session duration), the Create Segment option is not available. You can also create a segment using the report menu and global filter summary area. Your segment is now saved on the Segments landing page and is available to apply as a filter to other reports from the global filter options or from within reports, like campaigns, that you’re configuring.
Keep in mind that as you’re building any report, Analytics keeps track of what you’re doing. The next time you log into Analytics, your report will be in the same state it was when you last logged off.
To save a report so you can share it with others, take a look at the Adding a Favorite topic.
Why User Counts Can Vary
Analytics can have duplicate user counts. Let’s look at how that can happen.
Analytics counts a user by assigning an internal user ID when a user installs the app and starts some type of event, for example, browsing a catalog. However, it’s possible that the same user could install and use the app on multiple devices, and would therefore be counted as multiple users. Or, a user could delete and reinstall the app and use it on the same device, which would result in the user being counted twice, or however many times the user reinstalls and uses the app. Additionally, if the user only installs the app without using it, the user is not counted at all.
How Filters Affect User Count
It’s important to know in Analytics, filters have precedence; that is, the order in which they’re applied affect user count. The global date selector, global filters, and report filters all act to select the users you want to analyze. Any user count shown is a result of the filters and date selectors that are set above it, but not below it. This can lead to different numbers being shown at different "levels" of the filter.
Here’s the filter precedence:
Global date selector > Global filters (if used) > Report filters
Let’s look at an example:
-
You use the global date selector to analyze the last 90 days of all user activity in your app. The number returned is 10,000 users.
-
You set a global filter for only users in California. The number returned is 5,000 users (or 50%).
-
You set the User report filter to New Users, to select only New Users in California. The number returned is 2,500 users (or 25%).
-
Finally, you open a sessions report. That report would also show a total of 2,500 users because it is displaying the information for all filters set at or above the User report filter.
-
However, if you return to the global filters and select, say, the technology > iOS filter, the user numbers will be relative to 10,000, a result of the global date selector. The number returned will not be influenced by the filters set below the Global filter, in this case the User report filter.
