6 Retention
Retention reports follow groups of users, called cohorts, from the time they first perform an event. You can gain insight into what content users are consuming, what product changes are a hit, and how successful your marketing campaigns are by looking at how often these cohorts come back to your app.
How Long Are Users Sticking Around?
Retention analysis answers this question by looking at how long users are staying in your app and how often they’re coming back, so you can track drop-offs across time. Most business experts agree that customer retention on average costs seven times less than customer acquisition. Retention analysis puts you way ahead of the pack among your competitors if you know how you’re doing on this important metric. While customers still consider price, they’re also interested in value, which includes personalized content focused on their preferences. So, the longer you keep customers engaged, the easier it is for you to gather insights into what’s bringing users back time after time.
Retention reports help you answer questions like:
-
Which users never return after a first look at your app?
-
Does one version of your app retain more users than another?
-
How does clicking on a new product announcements correlate to how often users return?
-
Do users who cash in coupons come back to your app more often?
-
Does signing up for a loyalty club result in users purchasing more often?
What Kinds of Things Can I Do with Retention?
-
Create a retention report to find out if users who sign up for notifications during a promotion are more likely to be repeat customers.
-
Use retention to find out if the amount of discount offered during these promotions affects repeat behavior.
-
Find out if users who sign up for your app on weekends and holidays are more likely to return.
-
Discover if users who favorite songs in your music app are more likely to return versus those who don’t.
-
Find out if users are more likely to purchase a product if they’ve previously read product reviews.
-
Evaluate if the acquisition source (search engine vs. an email campaign, for instance) influences user retention.
Retention Reports: Try This First
If you want to see who your loyal users are over time, or if your new products keep users coming back for more, retention analysis will show you. Here’s an example of how you do it:
-
Click the Application menu and choose the Easy Shopping app.
-
From the side menu, click Retention.
-
From the global date selector, choose Last 90 days.
-
From the first event drop down menu, select Catalog Browsed.
-
From the second event drop down menu, select Checkout.
-
Click Run Report.
Use Retention analysis as a first step in creating campaigns to re-engage users, or in keeping interested users in your app even longer. You can use these insights to build deeper relationships with your customers, or bring back users who have dropped off.
Tracking Cohorts and User Groups: The Difference Between Retention and Funnels Analysis
When working with retention reports, keep these things in mind:
-
A group of users you’ve defined and are following in a retention report is called a cohort. Cohort is a term unique to retention reports because it identifies users associated with a time period in some way or another, in this case, the time they started an event. On the other hand, funnels are not specifically concerned with the element of time, so we refer to users going through a funnel simply as user groups.
-
Since both funnel and retention reports are based on users completing events, you may be wondering what the difference is between them. The key is that Retention shows you the data over a time interval of days, weeks, and months. So while both funnel and retention reports could track the same events, funnels show all the data from the time block as one lump; retention breaks it down by individual cohorts over the time intervals to show, as its name implies, who is retained over time and is “sticking around”.
-
Once you create a retention report, the display region shows the most recent report you’ve run and its criteria and the date ranges you selected until you run it again.
Example: Creating a Retention Report from the Retention Category
Let’s use the Easy Shopping app to look at an example of creating a Retention report.
Let’s say you created a VIP membership users can sign up for that offers various perks, like discounts and freebies, on the membership anniversary. Let’s look at 1) how many users signed up for the VIP membership, and 2) how many returned to make a checkout with their first discount coupon. Note that this example includes an attribute named promo. Your developer can add this to your list of attributes if you don’t have it.
To create the retention report:
-
Click Retention on the side menu.
-
Click the global date selector and choose a date range.
-
For the first event, choose SignUp.
-
For the second event, choose Checkout.
-
Click Add Attribute, click ANY, then Add Attribute again.
-
From the drop down menu, select Promo, then click Apply.
-
Now that the events are set up, click Run Report.
The retention report should look something like this:

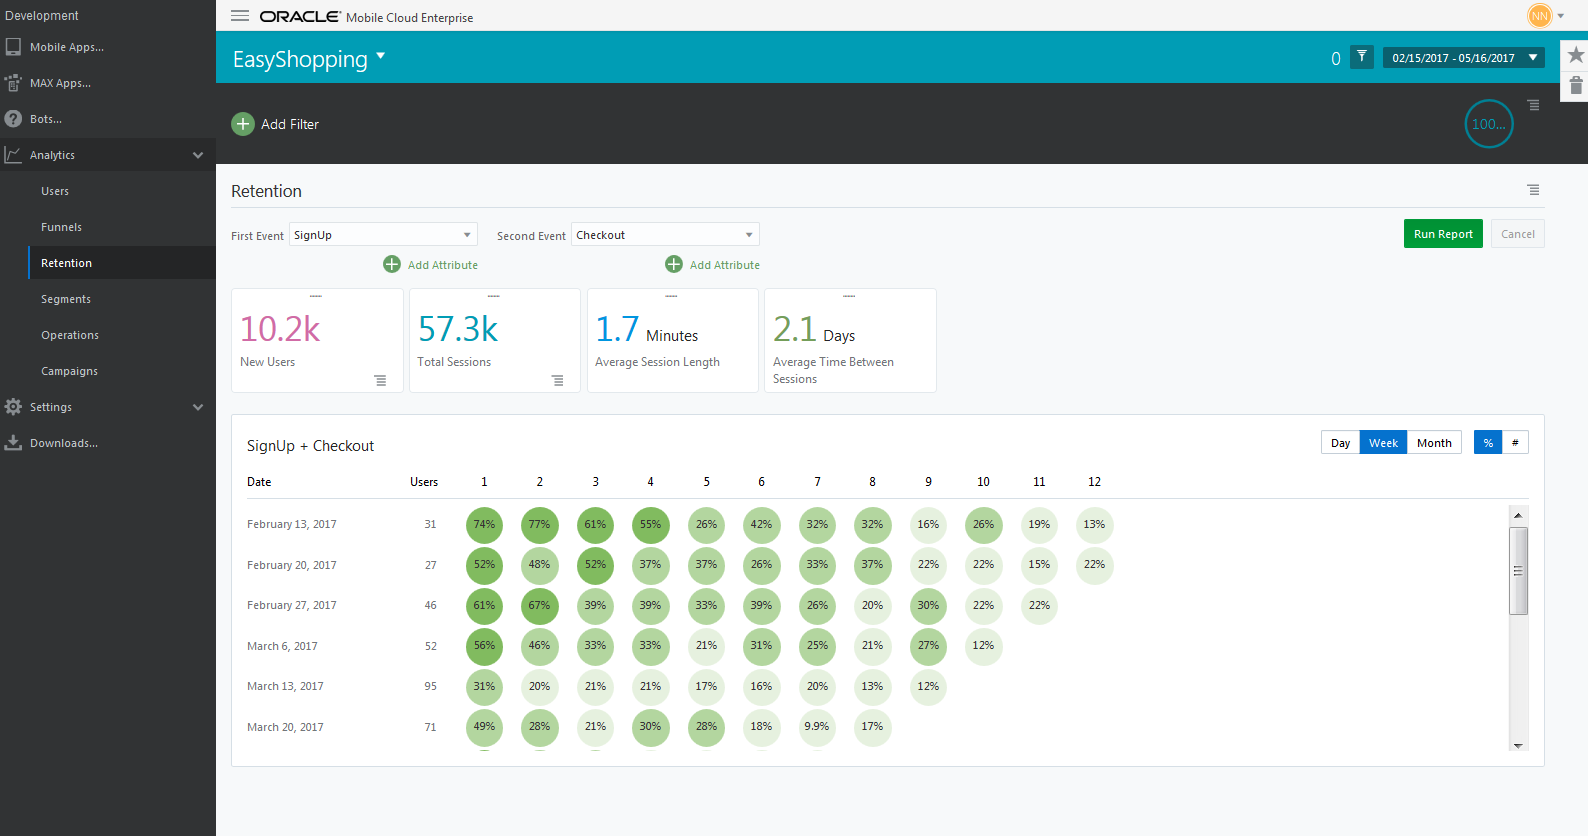
Description of the illustration retention-report-tour.png
Here’s a look at the retention report results:
-
Metrics on new users and sessions are summarized on tiles across the top.
-
The chart displays event-based retention. That is, the rows and Users column in the chart show the number of new users who completed the first event (sign up) on a given week. The percentages (or numbers, if that’s what you chose to display) to the right show the share of those users who returned on successive weeks to complete the second event (checkout) over the selected date range (February 15, 2017, through May 16, 2017). If your date range is long enough, you can break down the results by day, week, or month by using the interval controls on the chart.
-
Taking a closer look at the data, you can see of the 31 new users who signed up for the membership, 74% checked out the first week (February 13), 77% did so the second week (February 20), 61% did so the third week (February 27), and so on. Looking at the next week in the interval, of 27 new users who signed up, 52% checked out that week (February 20), 48% did so the following week (February 27), 52% did so the week after that (March 6), and continuing on.
Note:
In the example above, it may appear there’s a discrepancy between the selected date range and the date range on the chart. The difference is because retention reports will always begin on the Monday before the selected date range (in this case, February 13, 2017).
Editing a Retention Report
You can edit the events or attributes of a retention report simply by changing these values in the drop down menus at the top of the report and running the report again. Additionally, if you make any changes using the global date selector or global filters, the retention report will automatically run again and update your results.
Creating a Segment from a Retention Report
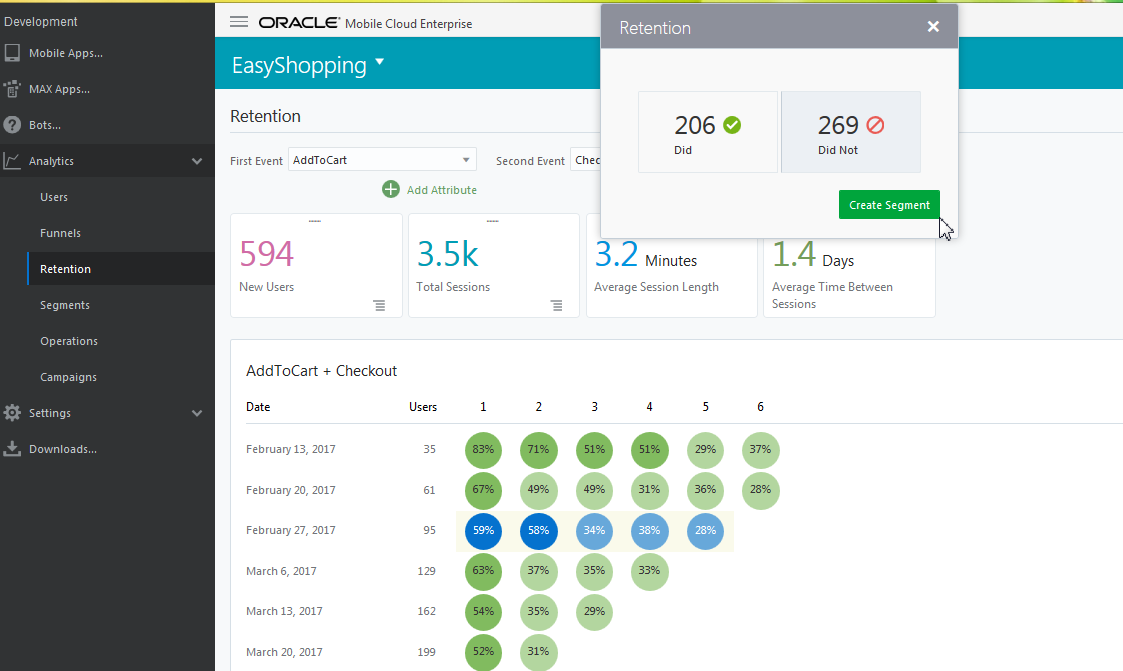
You can create segments from a retention report just by clicking on individual cells or dragging across rows and columns that interest you. As an example, suppose you want to target the users who did not make a purchase the week of February 27. To create a segment of these users, click and drag across each of the percentages for that week. When the dialog appears, click the Did Not option, then click Create Segment .
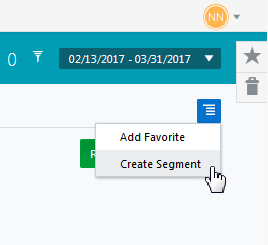
If you’d like to save all the data in the Retention report as a segment, click the Report menu instead.

