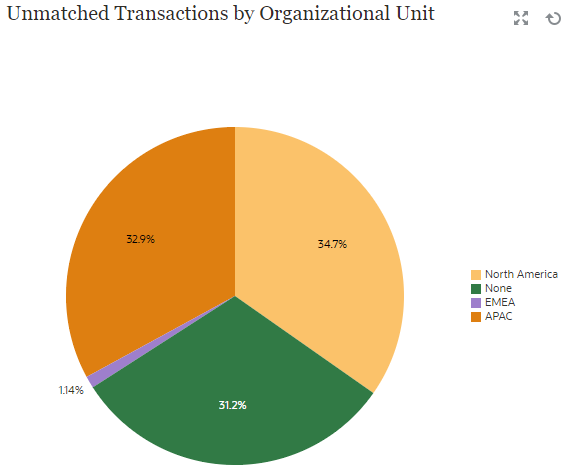
Chart View: Unmatched Transactions by Organizational Unit
This chart view displays a pie chart for the unmatched transactions for each organizational unit.
The generated chart appears as follows:

To create this chart view:
- Within the dashboard, for the required view, click the View Selector and select Chart View.
- Click Object and select Profiles.
- Click Settings.
- In the Properties tab:
- Set the Title to Unmatched Transactions by Organizational Unit.
- In Type, select Pie.
- Select Display as a Percentage.
- In the Layout tab, in the Legend (Series) section, click Add to add
two rows with the following properties:
- In Value, select Unmatched Transactions Source System (Count). In Aggregation, select Sum. In Categories, select Organizational Unit.
- In Value, select Unmatched Transactions Subsystem (Count). In Aggregation, select Sum. In Categories, select Organizational Unit.
- In the Legend tab, in Palette, select Redwood.
- Click OK to save the chart settings.