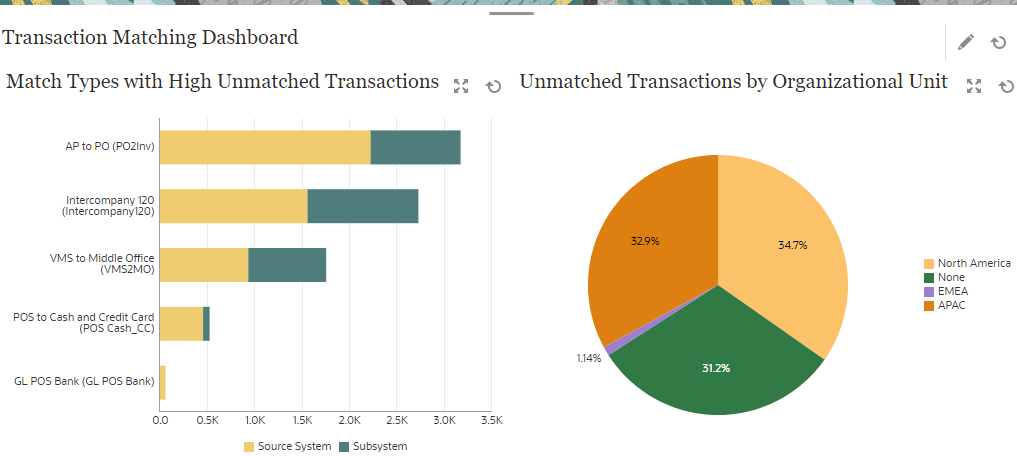
Example: Transaction Matching Dashboard
This example contains two Transaction Matching charts - a Column chart and a Pie chart.
- Chart View: Match Types With High Unmatched Transactions
- Chart View: Unmatched Transactions by Organizational Unit
The dashboard looks as shown below.

To create the dashboard in this example:
- From Home, select Dashboards, then Custom.
The existing custom dashboards are displayed.
- Click the Add icon to create a new dashboard.
A new dashboard is created with a default name and is opened in a new tab.
- Click Settings for the dashboard, to update the dashboard properties.
- Set the Name to Transaction Matching Dashboard
- Set the Layout to Vertical.
- Select Vertical Split.
- Click Settings for the view on the left and create a chart view. See Chart View: Match Types With High Unmatched Transactions.
- Click Settings for the view on the right and create a chart view. See Chart View: Unmatched Transactions by Organizational Unit.
- Click Save.
The created views are all displayed in the dashboard.
You can do the following:
- Click any area in a chart view, or any total in a list or pivot view, to drill down and view the individual records that comprise the selected area or total.
- Add a new filter to the view by using Add a Filter for that chart view.
- Click Run to view the dashboard and its data in Run mode.
- Click Expand for any view to display that view in the entire dashboard.