A Report Authoring Tips
This section provides tips and guidelines for creating effective and timely reports.
Common Report Authoring Tips
Improve all of your Oracle Fusion Data Intelligence reports with these recommendations and answers to frequently asked questions regarding reporting. The information isn’t exhaustive and is updated regularly with additional information and authoring tips.
Tips for Filters
When applying filters to reports, follow these guidelines:
- Use dashboard filters instead of workbook or canvas filters for user interactions in analyses.
- Use workbook filters for hidden and non-interaction filters.
- To improve the performance of prompts, set the Limit by Values to None in System Settings so that it's applied to all workbooks by default. You can change this setting in specific workbook filters if needed, however the default value of None should remain.
- When applying a filter on an attribute, use a Code column (when available) instead of a Name or Description column.
- Always apply the necessary filters first before you start building visualizations to ensure optimal queries are created when you add the metrics required in the visualization.
Tips for Brushing
Disable brushing to improve report performance. See Update Canvas Properties.
Tips for Working with Currency
To display the currency format for currency amounts, set the number format in each visualization as a custom currency. Then in the subject area folder, select the currency column. See Set Currency Symbols for Visualizations.
Tips for Reporting on Attributes Across Multiple Dimensions
When reporting on attributes against multiple dimensions, always use a measure in the report. In subject areas with more than one fact, the measure sets the correct context in the query, builds an accurate navigational path, and returns the expected results. If you don’t want the measure to show in the report, hide it. See Hide or Delete a Column.
Tips for Presentation Hierarchies
To improve performance, use presentation columns instead of presentation hierarchies. See Work with Presentation Tables and Columns.
Report Authoring Tips for Oracle Fusion HCM Analytics
Improve your Oracle Fusion HCM Analytics reports with these recommendations and answers to frequently asked questions regarding reporting. The information isn’t exhaustive and is updated regularly with additional information and authoring tips.
Tips for Improving Performance of all HCM Reports
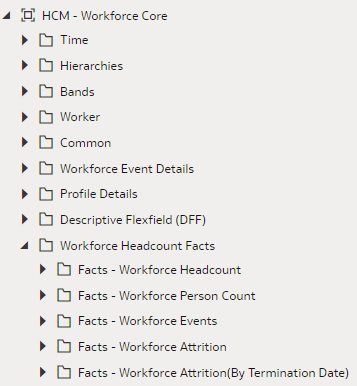
- Use the prebuilt fact metrics whenever possible under the subject
area you're using for your report. For each subject area, select the closest or
most appropriate prebuilt metric for your reports, and then apply filters as
needed.
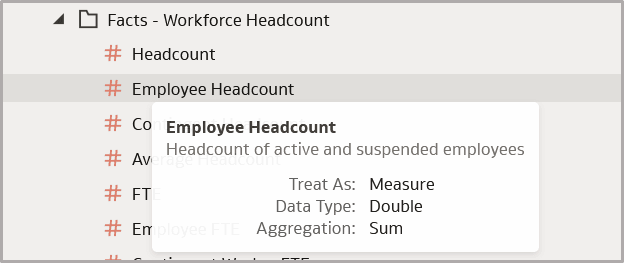
Hover over the metric name to see a description of the metric to use for your workbook. For example, to get a headcount of employees use the Employee Headcount metric.
See Prebuilt in this guide for details. - Use prebuilt metrics to build custom calculations.
- Validate each customization for accuracy.
- Review the latest updates in this publication (Reference for Oracle Fusion HCM Analytics) to learn about the most appropriate objects and methods for creating customized reports.
Tips for Improving Performance of Reports with Department or Organization Hierarchy Folders
When creating a report that uses attributes from the Department or Organization Hierarchy folders, set filters for Tree Version Effective Start Date and Tree Code to improve performance.Tips for Improving Performance of Reports with Position Hierarchy Folders
When creating a report that uses attributes from Position Hierarchy folders, use the filters for Top Position Name to improve performance.
Tips for Improving Performance of Reports on Top Manager, Manager Hierarchy, Assignment Manager List, or Bottom-Up Manager Hierarchy Queries
To improve the performance of Top Manager, Manager Hierarchy, Assignment Manager List, or Bottom-Up Manager Hierarchy queries, follow these guidelines:
- Run the refresh process Refresh Manager Hierarchy with a null parameter and then with a zero (0) parameter in Fusion Applications prior to running the ETL to see the data in the Manager Hierarchy or Assignment Manager List folders.
- Filter on Manager Name and Time: Year, Quarter, Month, or Date when any user other than Line Manager runs a report with attributes from the Manager Hierarchy or Assignment Manager List folders in either the select list or the filter list because data in these hierarchy folders are date effective.
- Use attributes from the Assignment Manager List folder (instead of from the Manager Hierarchy folder) when you aren't drilling to Manager Hierarchy to improve report performance.
Tips for Improving Performance of Reports on Worksheet Manager Hierarchy or Worksheet Manager Hierarchy List in HCM – Workforce Rewards – Workforce Compensation Queries
To improve performance on Worksheet Manager Hierarchy or Worksheet Manager Hierarchy List in HCM – Workforce Rewards – Workforce Compensation queries, follow these guidelines:
- Run the Synchronize Hierarchy process by providing Plan Name and Cycle Name as parameters in Fusion Applications prior to running the ETL.
- Filter on Manager Name when any user other than Line Manager runs a report that has attributes from the Worksheet Manager Hierarchy or Worksheet Manager Hierarchy List folders either in the select list or in the filter list.
- Use attributes from the Worksheet Manager Hierarchy List folder (instead of from the Worksheet Manager Hierarchy folder) when you aren't drilling to Manager Hierarchy to improve report performance.
Tips for Improving Performance of Reports on HCM – Workforce Rewards - Workforce Compensation Queries
To improve performance on Reports in HCM – Workforce Rewards – Workforce Compensation queries, follow these guidelines:
- When reporting on headcounts, use a date filter applied to the most
recent refresh date (or month) to report on the latest snapshot of data. Using
To_DateTime(VALUEOF(NQ_SESSION.CURRENT_GREGORIAN_DAY),
                        'DD-Mon-YY')
significantly reduces the time and resources necessary to run the report. - Filter using event-based flags
Tips for Improving Performance of Reports on Headcounts
When creating a report using the Headcount metric, the returned value is the last day of the selected period, or if you do a daily refresh, is the most recent snapshot refresh date. If you use the Headcount metric without a filter, you will only see the most recent snapshot. Apply a date filter on the most recent refresh date to select only the most recent data.
Use the expression
To_DateTime(VALUEOF(NQ_SESSION.CURRENT_GREGORIAN_DAY), 'DD-Mon-YY')
to create the filter on the most recent date, which significantly reduces
the query time and resources to return the data you want. 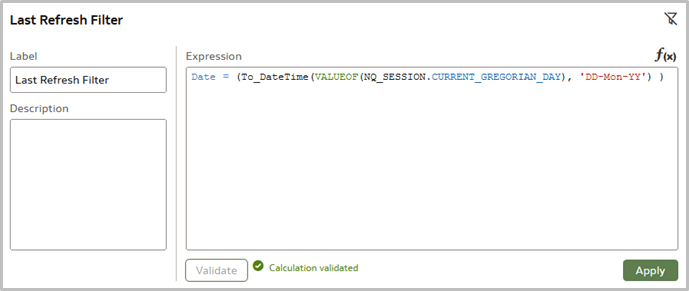
Description of the illustration lastrefreshfilter.png
You can use the same principle to select headcount by month. Since
headcount by month is returned using the last day of the month, apply an explicit
filter to use the last day of the month and the most recent snapshot date to improve
performance. 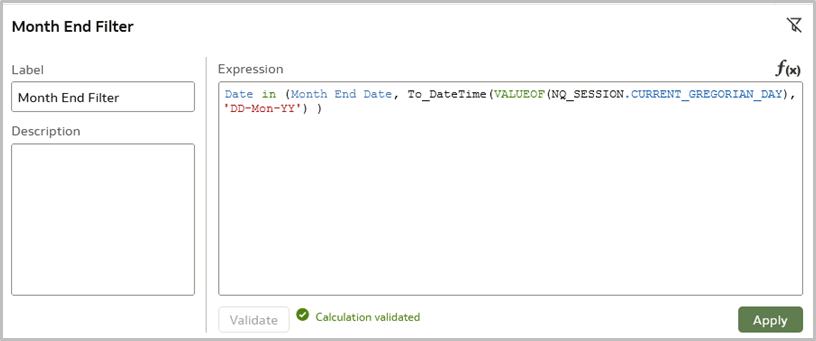
Description of the illustration monthendfilter.png
Tips for Using Event-Based Flag Filters
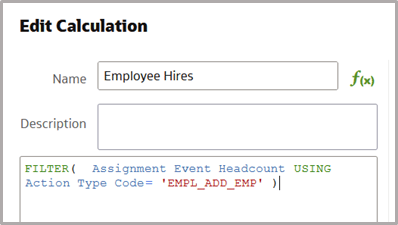
The Assignment Event fact table records all changes and events related to an employee's employment. Use the provided filters to get the results you want. For example, to see Employee Hires by Month, you can use the action type EMPL_ADD_EMP to select new employee hires.
Note:
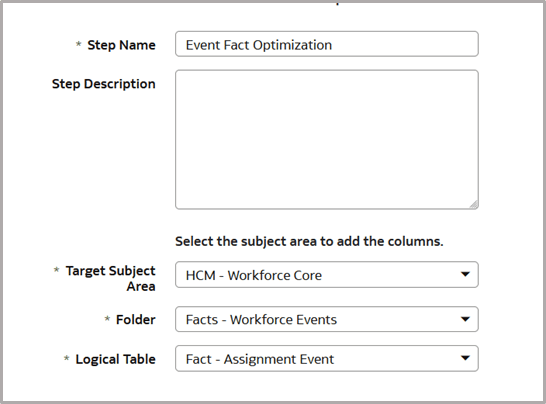
You'll need to use the semantic model extension to use this flag if it's not already available in the subject area.- Create a new step for Add Column.
- Add the HIRE_EVENT_IND physical column from the fact table and map it to a new logical column named Hire Event Ind. Be sure the new column is set to Display.
- Save and publish the new step.
In the folder where you published the new step, you see the new Hire Event Ind column.
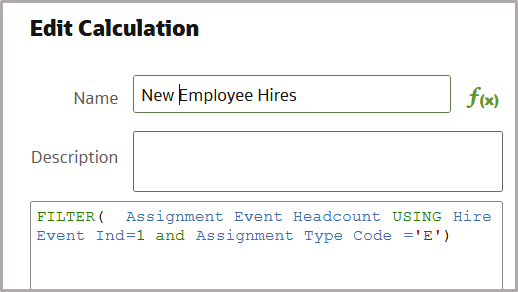
- In the Employee Hire column calculation in the workbook, replace
the EMPL_ADD_EMP filter with a new calculation Hire Event IND = 1, and name it
New Employee Hires. Add the filter on Assignment Type Code to select employees
only..
Tips for Improving Performance of Reports on HCM - Diversity Analysis Subject Area Queries
To improve performance on HCM - Diversity Analysis subject area queries, follow these guidelines:
- When a report uses any statistical attributes from the folders
Promotion Details (Age), (Ethnicity), (Gender) or Termination Details; (Age),
(Ethnicity), (Gender) or Salary Details; (Age), (Ethnicity), or (Gender), you
need to include the following columns in the report to ensure the statistical
attributes are calculated at the correct grain:
- Reporting Establishment.Reporting Establishment Name
- Time.Year
- Legislative Job Category.EEO-1 Category
- Country.Country Name
- If you are reporting on Age, Ethnicity, or Gender, also select Age code, Ethnicity, or Gender from the same folder as the statistical attributes.
- When a report has any statistical attributes from the folders Hiring
Details (Age), (Ethnicity), or (Gender), you need to include the following
columns in the report to ensure the statistical attributes are calculated at the
correct grain:
- Time.Year
- Location Details. Location Name
- Legislative Job Category.EEO-1 Category
- Country.Country Name
- If you are reporting on Age, Ethnicity, or Gender, also select Age code, Ethnicity, or Gender from the same folder as the statistical attributes.
Tips for Improving Performance of Reports on HCM - Learning Subject Area Queries
When building a report using the HCM - Learning subject area, include a Time dimension attribute such as Time.Date in the report.
Tips for Improving Performance of Reports on HCM - Workforce Time and Labor Management Subject Area Queries
When designing visualizations, always define default values for the prompts, and choose the most selected values as defaults.
Tips for Using Timestamp Fields As Filters in Reports On HCM - Health And Safety Incidents Subject Area Queries
When filtering on Timestamp fields, use "is greater than or equal to", "is greater than", "is less than or equal to", "is less than", or "between".
Tips for Improving Performance of Reports on HCM - Diversity Analysis Queries
- Use the prebuilt workbooks available and build or modify them whenever possible. You can make a copy of the original workbook in a custom folder.
- Remove TopN filters on Year. Instead use explicit values, or dynamically pick the current year, and change it using -1 and -2 based on the current date to give similar behavior.
- Always leverage prebuilt metrics for all requirements until and unless that metric isn't available.
- For the tiles displaying current or previous month headcount metrics, filter on one day instead of multiple years.
- Apply the selective filters only to the visualization as needed. Adding filters on the visualization where it isn't needed degrades the efficiency of the query.
- Convert generic filters to dashboard filters with the Apply button to avoid sending pre-matured queries to the database. This reduces unnecessary load on the database.
- Instead of using variables for Year, Quarter, and Month filters, create prompts on Time.Year and bind the prompt to the variabel created on Year. Variables created for quarter and month are set to a default value of All, so these prompts can be set to limit by Year, and Year and Quarter.
- The Geo Selector derived attribute uses Department Hierarchy. Department Name is in the else part, which is nothing but the leaf node in the hierarchy. Therefore, use Common.Department.Department Name which will reduce the additional call to the Hierarchy table.
- Tune the OCPU limit of Autonomous Data Warehouse.
- In master/detail reports, ensure filters are aligned on all people.
- In master/detail reports, ensure assignments for each person use the same worker type (such as pending or contingent) to avoid reporting two workers per person (one pending and one contingent).
- In master/detail reports, be aware that inactive pending worker assignments the manager name is NULL.
- In master/detail reports, ensure when assignment level attributes are added that you restrict the pending worker types by adding a filter on "assignment type <> 'P'".
Tips for Improving Cross-Subject Area Queries
- When joining two subject areas in a report, be sure to use at least one attribute from a common dimension used in the report.
- When using common dimensions, always pick attributes from the common dimension from a single subject area.
- Always include a measure from each subject area that is used in the report.
- If all the metrics and attributes needed for the report are available in a single subject area and fact, use that subject area only and don't create a cross-subject srea query. Such a report performs better and is easier to maintain.
Limitations for Reporting on the Seniority Dates Functional Area
- Grade Step
- Union
- Collective Agreement
Recommended Filters
Items with an asterisk (*) are required.
| Subject Area | Presentation Columns (* Required Filter) |
|---|---|
| HCM - Benefits |
Time.Year* Legal Employer.Legal Employer Name* Time.Quarter or Month Benefit Program.Program Name Benefits Plan.Plan Name Country.Country Name Business Unit.Business Unit Name |
| HCM - Check-Ins |
Time - Year or QTR or Month* or Time – Enterprise Year or Enterprise Quarter or Enterprise Period* Review Period.Review Period Name |
| HCM - Course - Offering Rating and Profile Outcome | Presentation Columns: Time.Year* |
| HCM - Diversity Analysis |
Promotions/Salary/Terminations-based reports: Time.Year* Reporting Establishment.Reporting Establishment Name EEO-1 Category (Job category) Country.Country Name Hiring-related reports: Time.Year* Location Details.Location Name Legislative Job Category.EEO-1 Category (Job Category) Country.Country Name |
| HCM - Goals and Career Development |
Content based on Performance Goals-related measures:
Content based on Development Goals related measures:
|
| HCM - Health and Safety Incidents |
Time - Year or QTR or Month or Date* |
| HCM - HR Help Desk Requests Overview |
|
| HCM – Journeys |
Time – Year or QTR or Month* or Time – Enterprise Year or Enterprise Quarter or Enterprise Period* Allocated Journeys.Allocated Journey Name Manager Information.Manager Name |
| HCM - Learning |
Time – Year or QTR or Month * Common folder: Business Unit Name or Department Name or Location Name
|
| HCM - Learning Items and Enrollments | Presentation Columns: Time.Year* |
| HCM - Opportunity Marketplace Gigs | Time*.Year/ Quarter/Month/Date |
| HCM - Performance Management |
|
| HCM - Positions |
Time – Year or QTR or Month* |
| HCM - Profile Matching |
When reporting on content based on attributes from Person Profile – Skill Gap Details, add these filters:
|
| HCM - Specialization Rating and Profile Outcome | Presentation Columns: Time.Year* |
| HCM – Succession Management |
|
| HCM - Talent Acquisition |
Time - Year/QTR/Month/Date* Organization.Organization Name Job Requisition - Primary Geography.Geography Name |
| HCM - Talent Profile |
When reports use metrics from a Model profile based on a Job or Position, use one of these filters:
When a report has metrics from Person Profile, use the filters from: Person Profile - Skills and Qualifications or Talent Ratings |
| HCM - Talent Profile Trends | Time - Year or Quarter or Month* |
| HCM - Talent Review Meetings | Time - Year or QTR or Month* or Time – Enterprise Year or Enterprise Quarter or Enterprise Period * |
| HCM – Worker Seniority | Seniority Details.Seniority Rule Name* |
| HCM - Workforce Absence Management |
Content based on facts in the Absences folder:
Content based on facts in the Employment Plan Participation folder:
When reporting on Accrual Balance, you must include one of these filters:
|
| HCM – Workforce Core |
|
| HCM - Workforce Gains and Losses |
Time.Year or QTR or Month* or Time – Enterprise Year or Enterprise Quarter or Enterprise Period* This subject area provides gains and losses based on various Assignment events, so when reporting on this subject area, use a filter from the list below to identify gains and losses from a particular type of event:
|
| HCM - Workforce Rewards - Payroll Balances |
Time – Year/QTR/Month*: Filter using smaller time periods to improve performance Payroll Period – Period Name (in particular when the report is at Person Grain) Payroll.Payroll Name* When using Balance Value (base measure) in a report, apply a filter on Balance Dimension.Balance Dimension Name.to prevent metric values from being multiplied by the number of configured balance dimensions |
| HCM - Workforce Rewards - Payroll Costing |
Time – Year/QTR/Month or Time.Date*: Filter using smaller time periods to improve performance). Element – Element Classification Name Use at least one segment from the Costing Segments folder; use the Segment code wherever possible* Payroll.Payroll Name* |
| HCM - Workforce Rewards - Salary Basis |
|
| HCM - Workforce Rewards - Workforce Compensation |
Compensation Plan Cycle.Plan Cycle Name* Business Unit.Business Unit Name Compensation Plan.Plan Name* |
| HCM – Workforce Time and Labor Management |
Time – Year or QTR or Month* Reported Time Card Start Date and Time Reported Time Card End Date and Time Common folder: Business Unit Name or Department Name or Legal Employer Name. |
Guidelines to Setup Payroll Balance Groups in Oracle Cloud HCM and Fusion Data Intelligence
The Fusion Data Intelligence HCM - Workforce Rewards - Payroll Balances subject area pulls payroll balance data from Oracle Cloud HCM according to settings in the Analytics Warehouse Balance Group.
Note:
Failing to follow these recommendations and considerations may negatively impact the performance of data extractions and reports.Payroll Balances Accelerator Guidelines
- Include RUN Balance Dimensions: Use only the RUN balance dimensions as specified in the default recommended balance group section. Add relationship level dimensions unless there's a specific requirement for assignment level balances.
- Exclude Period-To-Date Accumulations and Total Base Categories: Don't add dimensions related to Period-To-Date accumulations (for example QTD, YTD, MTD) or base categories for Total Balances, as these are calculated by Fusion Data Intelligence with prebuilt business metrics in the subject area.
- Avoid Excess Base Dimensions: Adding extra base dimensions for a base category or balance name may cause performance issues due to large data volumes, which might not be useful for analytical or reporting purposes.
- Mandatory Filtering: Filter by specific base dimensions to ensure accurate payroll balance reporting and analysis. Without this filter, balance values may be incorrectly aggregated across base dimensions, leading to inaccurate results.
Default Recommended Balance Group Setup - For Legislations - United States
| Base Category | Base Dimension (Default) |
|---|---|
| Earnings | Relationship Tax Unit Run |
| Supplemental Earnings | Relationship Tax Unit Run |
| Voluntary Deductions | Relationship Tax Unit Run |
| Involuntary Deductions |
Relationship Tax Unit, Third Party Payee, Reference Code Run Relationship Tax Unit, Reference Code Run |
| Pre-Statutory Deductions | Relationship Tax Unit Run |
| Miscellaneous | Relationship Tax Unit Run |
| Employer Taxes | Relationship Tax Unit Run |
| Employer Charges | Relationship Tax Unit Run |
| Employee Tax Credits | Relationship Tax Unit Run |
| Direct Payments | Relationship Tax Unit Run |
| Hours | Relationship Tax Unit Run |
| Nonpayroll Payment | Relationship Tax Unit Run |
Default Recommended Balance Group Setup - For Legislations - United Arab Emirates, Qatar, Saudi Arabia
| Base Category | Base Dimension (Default) |
|---|---|
| Earnings | Relationship Run |
| Supplemental Earnings | Relationship Run |
| Voluntary Deductions | Relationship Run |
| Miscellaneous | Relationship Run |
| Employer Taxes | Relationship Run |
| Employer Charges | Relationship Run |
| Employee Tax Credits | Relationship Run |
| Direct Payments | Relationship Run |
| Hours | Relationship Run |
Default Recommended Balance Group Setup - For Legislations - Canada
| Base Category | Base Dimension (Default) |
|---|---|
| Absences | Relationship Tax Unit Run |
| Direct Payments | Relationship Tax Unit Run |
| Earnings | Relationship Tax Unit Run |
| Supplemental Earnings | Relationship Tax Unit Run |
| Taxable Benefits | Relationship Tax Unit Run |
| Involuntary Deductions |
Relationship Tax Unit, Reference Code Run Relationship Tax Unit, Third Party Payee, Reference Code Run |
| Pre-Statutory Deductions | Relationship Tax Unit Run |
| Tax Deductions | Relationship Tax Unit Run |
| Voluntary Deductions | Relationship Tax Unit Run |
| Employer Charges | Relationship Tax Unit Run |
| Employer Taxes | Relationship Tax Unit Run |
| Hours | Relationship Tax Unit Run |
| Information | Relationship Tax Unit Run |
| Miscellaneous | Relationship Tax Unit Run |
Default Recommended Balance Group Setup - For Legislations - United Kingdom
| Base Category | Base Dimension (Default) |
|---|---|
| Absences | Payroll Relationship, Run |
| Days | Payroll Relationship, Run |
| Direct Payments | Payroll Relationship, Run |
| Employer Charges | Payroll Relationship, Run |
| Employer Taxes | Payroll Relationship, Run |
| Hours | Payroll Relationship, Run |
| Information | Payroll Relationship, Run |
| Involuntary Deductions | Payroll Relationship, Run |
| Irregular Earnings | Payroll Relationship, Run |
| Miscellaneous | Payroll Relationship, Run |
| PAYE Deductions | Payroll Relationship, Run |
| Pre-Statutory Deductions | Payroll Relationship, Run |
| Regular Earnings | Payroll Relationship, Run |
| Taxable Benefits | Payroll Relationship, Run |
| Voluntary Deductions | Payroll Relationship, Run |
Default Recommended Balance Group Setup - For Legislations - Mexico
| Base Category | Base Dimension (Default) |
|---|---|
| Absences | Relationship Tax Unit Run |
| Standard Earnings | Relationship Tax Unit Run |
| Employee Tax Credits | Relationship Tax Unit Run |
| Employer Charges | Relationship Tax Unit Run |
| Employer Taxes | Relationship Tax Unit Run |
| Hours | Relationship Tax Unit Run |
| Information | Relationship Tax Unit Run |
| Involuntary Deductions | Relationship Tax Unit Run |
| Miscellaneous | Relationship Tax Unit Run |
| Pretax Deductions | Relationship Tax Unit Run |
| Social Insurance Deductions | Relationship Tax Unit Run |
| Supplemental Earnings | Relationship Tax Unit Run |
| Tax Deductions | Relationship Tax Unit Run |
| Taxable Benefits | Relationship Tax Unit Run |
| Voluntary Deductions | Relationship Tax Unit Run |
Default Recommended Balance Group Setup - For Legislations - China
| Base Category | Base Dimension (Default) |
|---|---|
| Direct Payments | Relationship Tax Unit Run |
| Absences | Relationship Tax Unit Run |
| Earnings | Relationship Tax Unit Run |
| Supplemental Earnings | Relationship Tax Unit Run |
| Taxable Benefits | Relationship Tax Unit Run |
| Pre-Statutory Deductions | Relationship Tax Unit Run |
| Tax Deductions | Relationship Tax Unit Run |
| Employer Charges | Relationship Tax Unit Run |
| Social Insurance Deductions | Relationship Tax Unit Run |
| Voluntary Deductions | Relationship Tax Unit Run |
Default Recommended Balance Group Setup - For Other Legislations
| Base Category | Base Dimension (Default) |
|---|---|
| Direct Payments | Relationship Tax Unit Run |
| Absences | Relationship Tax Unit Run |
| Earnings | Relationship Tax Unit Run |
| Supplemental Earnings | Relationship Tax Unit Run |
| Taxable Benefits | Relationship Tax Unit Run |
| Pre-Statutory Deductions | Relationship Tax Unit Run |
| Tax Deductions | Relationship Tax Unit Run |
| Employer Charges | Relationship Tax Unit Run |
| Social Insurance Deductions | Relationship Tax Unit Run |
| Voluntary Deductions | Relationship Tax Unit Run |
Payroll Balances in Oracle Cloud HCM and Usage in Fusion Data Intelligence
There are three main components of Payroll balances.
-
Balance Name: Specific names for each balance are customizable. For example, Basic Pay, Overtime, Bonus etc.
For example, Alex is an employee of the Sales team.- As part of his Payroll he gets one regular component, Base Pay, and three irregular payments based on eligibility, Overtime, Bonus, and Commissions.
- As per tax rules of applicable legislation there are two deductions: Medical Insurance and 401(K) Employee Contribution.
Category Amount Base Pay $4000.00 Overtime Pay $300 Bonus $1200 Commissions $2000 Medical Insurance $150 401(k) Employee Contribution $200 -
Base Categories
- Standard Earning: Regular earnings that are part of the base salary.
- Supplemental Earning: Additional earnings such as bonuses or commissions.
- Voluntary Deduction: Deductions chosen by the employee, such as retirement contributions.
- Involuntary Deduction: Deductions mandated by law, such as tax or garnishments.
- Hours: Recorded work hours or overtime.
- Information: Miscellaneous payroll-related information.
-
For example, Alex is an employee of Sales team.
- Each Balance Name has an associated base category.
- Some of the most common base categories are listed in the right column of the table shown.
Balance Name Base Category Standard Earnings Pretax Deductions Voluntary Deductions Supplemental Earnings Employer Taxes Involuntary Deductions Employee Tax Credits Miscellaneous Employee Tax Wages Employee Tax Deductions Employer Tax Wages Employer Liabilities -
Base Dimension shows three different perspectives.
- Time: Various periods such as Quarter to Date, Inception to Date, Month to Date, Year to Date, etc.
- Employment: Different employment relationships or assignments.
- Context: Location-based dimensions like Area, City, etc.
-
For example, Alex is an employee of the Sales team.
- Each balance has different base dimensions associated with it.
- Fusion Data Intelligence calculates values of Period To Date (QTD, MTD, YTD). Therefore the Analytics Warehouse Balance group shouldn't have Time-based Base Dimension added.
- Context-based Base Dimensions aren't supported so they shouldn't be added
Time Based Dimension Employment Based Dimension Context Based Dimension Relationship Tax Unit Run QTD Relationsip Tax Unit Run Relationship Tax Unit Run Area 1 Run Relationship Tax Unit RUn YTD Assignment Tax Unit Run Relationship Tax Unit Run Area 2 Run NA Relationship Run NA NA Assignment Run NA -
For example, Alex is an employee of the Sales team.
- Combining Balance Name, Base Category, and Base Dimension, you can see the results in the following table.
- Alex receives $4000 for base pay. To get that from balances data, filter on a specific base dimension such as Relationship Tax Unit Run.
- To ensure accurate reporting and analysis of Payroll Balances, filter by specific base dimensions.
- Without this filter, balance values may be incorrectly aggregated across dimensions, leading to inaccurate results.
- The Balance Group setup allows you to select specific balances/base categories/base dimensions that any organizations need for Payroll Analytics and Reporting.
Base Category Balance Name Balance Dimension Amount Standard Earnings Base Pay Relationship Run $4000 Standard Earnings Base Pay Relationship Tax Unit Run $4000 Standard Earnings Base Pay Assignment Run $4000 Standard Earnings Base Pay Assignment Tax Unit Run $4000 Standard Earnings Base Pay Relationship Tax Unit Run QTD $12000
