9 Machine Learning Applications
Overview
The prebuilt prediction applications based on machine learning modeling are designed to reduce complexity and provide these benefits:
- Improve operations and reduce business risk.
- Enhance visibility and deeper insights that aren't available through exploratory analysis.
- Plan for the future by predicting outcomes.
Diversity Analysis
The Diversity Analysis subject area leverages machine learning to assess diversity within your organization.
By combining parametric and non-parametric hypothesis testing for classification and scoring, Diversity Analysis continuously monitors key employment practices, including hires, terminations, promotions, and salary by gender, ethnicity, and age. By monitoring your employment practices, you can be proactive with initiatives that help address potential disparities.
This subject area draws on data from Oracle Fusion Cloud Human Capital Management (HCM) and Recruitment systems, keeping all information secure within your Oracle Autonomous Data Warehouse. It provides statistical evidence of potential bias, which you can explore through insightful data visualizations in Oracle Analytics Cloud. This allows your organization to gain a clear understanding of diversity metrics and take informed actions to foster a more equitable workplace.
Example 1
Based on the provided data, with a selection rate of 9%, only 20 out of 220
Black or African American individuals were hired. In contrast, the selection rate for
Caucasians stands at 20%. To investigate this disparity and determine whether it's
statistically significant, you can utilize various statistical tests, including the
z-test, Chi-square test, and Fisher's exact test. These methods help identify if the
observed differences are due to chance or if they're likely due to some systematic
effect.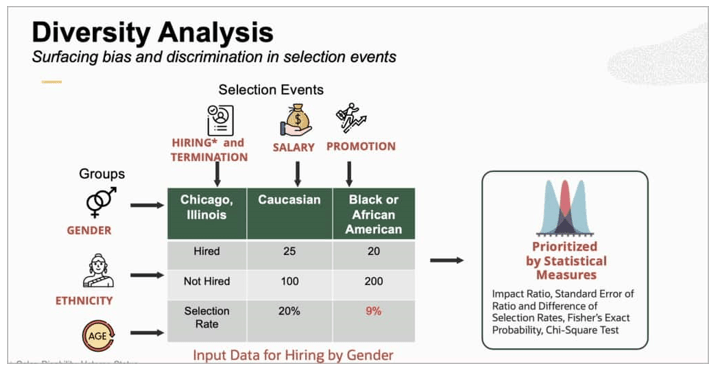
Description of the illustration fahia-diversity-analysis-surfacing-bias.png
The null hypothesis is "Employment decisions are non-discriminatory, or
Selection Rates are Equal" and when this hypothesis is tested with data, the ideal
result is to see a low standard deviation to validate the hypothesis. 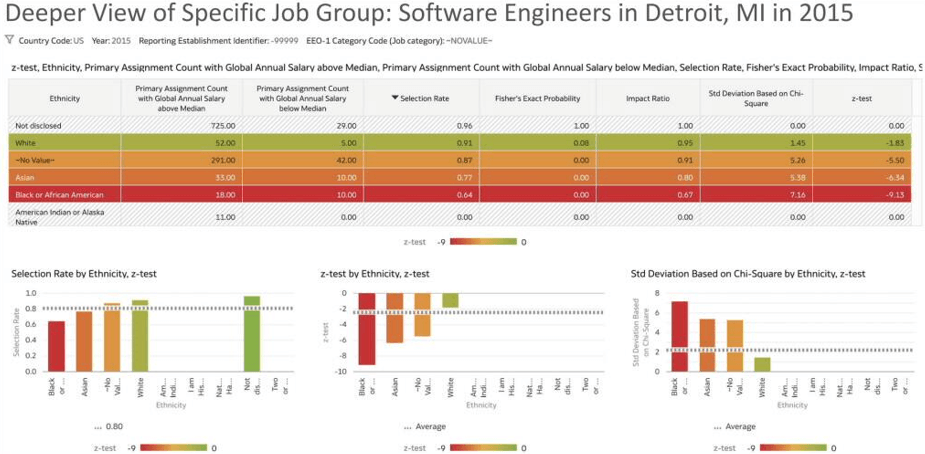
Referring to the image showing a deeper view of the specific job group, the Chi-square test and z test clearly indicate that there's a statistically significant difference in the selection rates of not only Black or African Americans but also Asians as compared to Caucasians. Look at how dispersed the data is in relation to the mean. This is sample data and doesn't represent any specific situation, community or company. Any resemblance is purely coincidental.
Because the hypothesis has been rejected, drill down further to understand the detailed data within the organization. The detailed report provides indicators that similar differences have existed over several years and might need to be examined.
You can extend the analysis with payroll data to find statistical evidence that salaries of Asians and Black or African Americans are below the median more often in the sample data. This further weakens the initial null hypothesis. The detailed report provides indicators that similar differences have existed over several years and might need to be examined. You can investigate further if needed to understand the depth and breadth of these differences through the organization.
Example 2
Using salary for comparing the compensation of employees within the same
reporting establishment, you can further analyze the data to understand the selection
rates and standard deviations for various ethnicities across multiple years, based on
the number of employees above or below median. In this example, using various
statistical attributes (such as z-test and Fischer’s exact probability), you can see
that the standard deviation for ethnic groups such as African American and Asians are
high in comparison relative to certain other ethnicities during a specific year (for
example, 2015).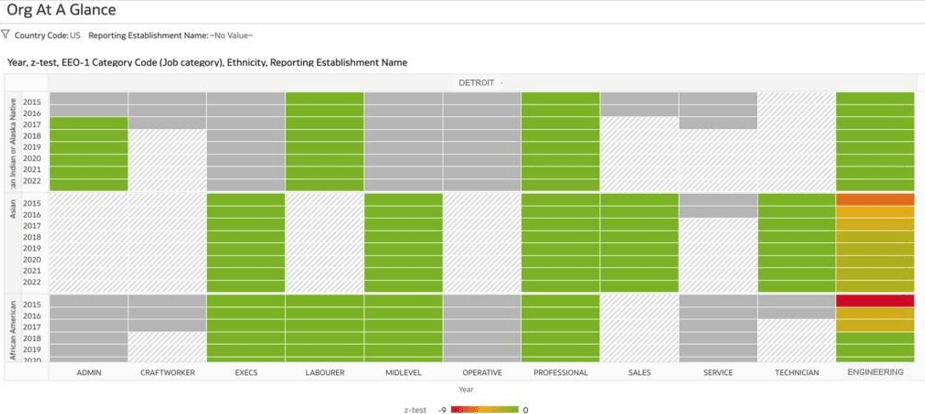
On further analysis, you can see that for a specific job category of
engineers, the standard deviations are high for the same ethnic groups. This
substantiates the argument that there are potential statistical indicators of
differences in salary for specific ethnic groups in the organization. These analysis act
as guiding data points for D&I leaders, people leaders, and organizations in
developing fair practices internally and monitoring them at regular intervals.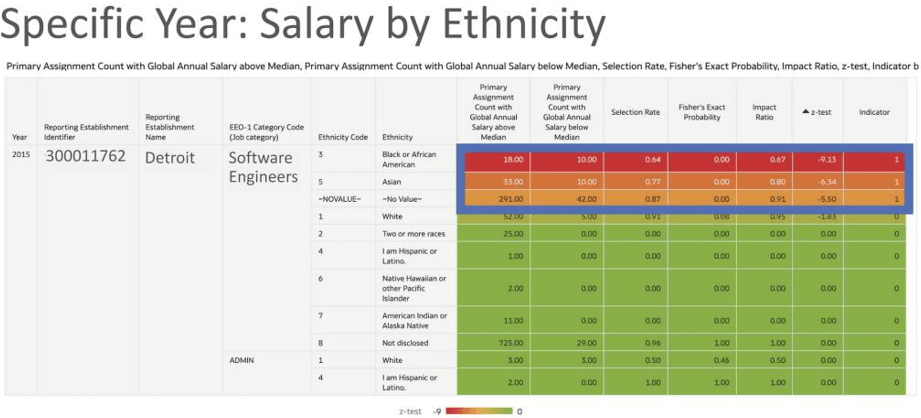
You can apply similar examples of comparing the selection rates and standard deviations across various ethnicities, age groups, and gender for HR events such as hiring, promotions, and terminations.
Prerequisites
The Diversity Analysis subject area requires that you enable and configure the Diversity Analysis Prerequisites and Diversity Analysis functional areas sequentially.
Tips to Configure for Diversity Analysis
To use Diversity Analysis properly, be sure you follow these configuration requirements.
- Enable Diversity Analysis Prerequisites first and then enable Diversity Analysis under Functional Areas from the Generally Available Features tab on the Enable Features page. See Enable Generally Available Features.
-
Create a data pipeline for the Diversity Analysis Prerequisites functional area. Complete the steps in Create a Data Pipeline for a Functional Area.
Follow these steps when you create the data pipeline:- Select Human Capital Management under Applications on the Console.
- In step 1 of the wizard to create a data pipeline, select
Human Capital Management Analytics in
Offering and Diversity Analysis
Prerequisites in Functional Area.

-
Create a data pipeline for the Diversity Analysis functional area. Complete the steps in Create a Data Pipeline for a Functional Area.
Follow these steps when you create the data pipeline:- Select Human Capital Management under Applications on the Console.
- In step 1 of the wizard to create a data pipeline, select
Human Capital Management Analytics in
Offering and Diversity
Analysis in Functional Area.

- In step 2 of the wizard to create a data pipeline, select
the appropriate parameter values.

Analyze Employee Diversity
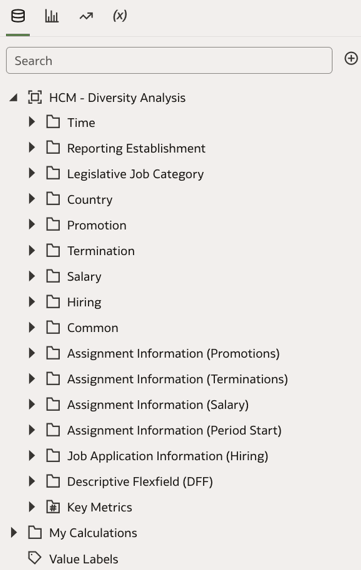
Once the data load is completed, you can create a workbook and analysis based on the HCM – Diversity Analysis subject area.
- Navigate to the Home page, click Create, and
click Workbook.

- In Add Data, search for "Diversity Analysis" and select HCM –
Diversity Analysis in the results.

- View the subject area details. The Diversity Analysis subject area
contains the worker’s basic information, assignment information for promotions,
terminations, salary changes, and job application information in the folders within
it. You can make use of the
attributes and facts to create your visualization.
- Understand and report on the following business questions:
- Hiring Practices
- Is there a statistically significant difference in the selection rates of candidates across different ethnicities, genders, and age groups?
- Which specific demographic groups such as gender and ethnicity are underrepresented in the hiring process?
- Are there consistent patterns of disparity in selection rates over multiple years or within specific departments?
- Promotions and Career Advancement
- Is there evidence of differences in promotion rates between different demographic groups within the organization?
- Are certain demographic groups consistently underrepresented in higher-level positions within the organization?
- Salary Equity
- Are there significant salary disparities between employees of different ethnicities or genders within the same job category?
- Does the analysis of payroll data reveal any persistent pay gaps for certain demographic groups across the organization?
- How do salary trends for different ethnic groups compare over time, and are these differences statistically significant?
- Employee Turnover
- Is there a statistically significant difference in termination rates across different demographic groups?
- Do exit rates differ significantly by gender, ethnicity, or age, and what are the implications for our retention strategies?
- Longitudinal Diversity Trends
- How have diversity metrics such as hiring, promotion, and salary evolved over time within the organization?
- Are there specific periods or events that correspond to changes in diversity metrics?
- Hiring Practices
Frequently Asked Questions
Review these questions to improve your understanding of the Diversity Analysis application.
-
How much data is needed for the Diversity Analysis model to be accurate?
The Diversity Analysis application runs analyses for employee subgroups within an establishment, within an EEO Job Group that are larger than 30 employees, and within demographic groups (by ethnicity, gender, or age above or below 40 years) exceeding 2% of the total. The application skips running the analysis on subgroups smaller than 5 employees.
-
What algorithms does the Diversity Analysis prediction model use?
The Diversity Analysis application uses statistical methods as found in most of the diversity and inclusion analysis research including but not limited to the four-fifths’ rule for historical reasons, Fisher’s Exact test, Chi-square test, and Z-test of the Ratio of Selection Rates.
-
How frequently does the Diversity Analysis model create predictions on future data?
There are no predictions in HCM - Diversity Analysis because it analyzes the existing data.
-
How frequently is the Diversity Analysis model calibrated or trained?
HCM – Diversity Analysis is run daily on the current data.
-
Are there any external benchmarks considered in the Diversity Analysis model?
No.
Profile Matching
The Profile Matching subject area semantically compares a worker's talent profile attributes such as degrees, competencies, memberships, licenses, certificates, languages, honors, and awards with all available job profiles in Oracle Fusion HCM Analytics.
Profile Matching assigns a match score for each attribute, an overall score, a percentile match score, and a skill gap score. Additionally, this subject area suggests upskilling requirements for the worker to become eligible for specific job profiles. The application stores the information in the HCM – Profile Matching subject area.
Example
Assume the job profile requires competencies in Artificial Intelligence and
Data Science. The Profile Matching subject area runs a trained similarity algorithm
against the worker's talent profile, assigning a matching score for each competency. If
the worker's talent profile includes Artificial Intelligence, then it assigns a value of
1. If the job requires Data Science but the worker has only Analytical Thinking, the
application assigns a similarity value of 0.3 based on vector representation of cosine
similarity of embeddings. Profile Matching provides similarity scores for all
attributes, and the matching score is the average of these items; in this case, it would
be (1 + 0.3) / 2 = 0.65. The application also provides an upskilling requirement for
each of the attributes that can help a worker become eligible for the job profile.
Attributes with a score less than 0.5 are shown as upskilling requirements for the
candidate. 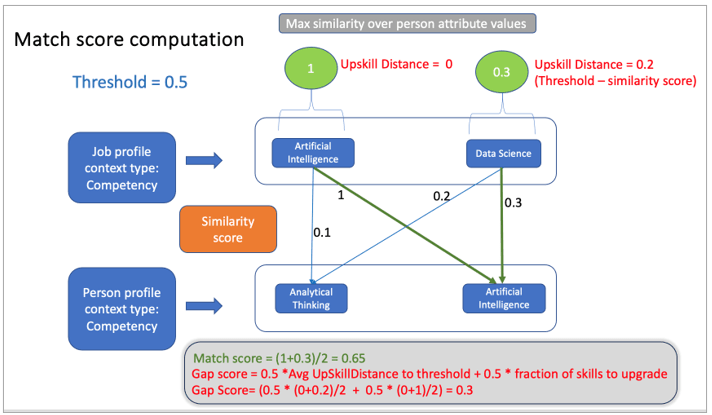
Description of the illustration fahia-match-score-computation.png
- -1 indicates exactly opposite characteristics to those required by the job.
- 1 indicates exactly similar characteristics to those required by the job.
- 0 indicates that the characteristics of person profile are neither opposite nor similar to those required by job; they are unrelated.
If there are 5 job profiles and there are 10 workers with active talent
profiles, then the profile attributes of all these active workers are compared with the
5 of those job profiles. 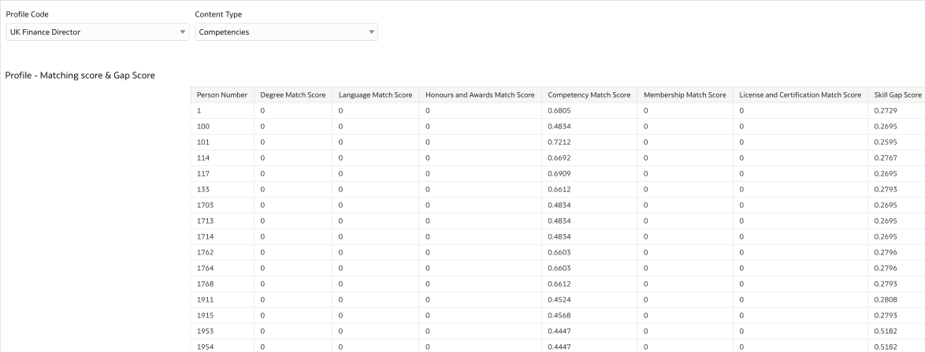
Prerequisites
- The Workforce Management functional area, Talent Profile functional area, and HCM - Talent Profile subject area.
- All Fusion HCM profiles must be configured with the following
attributes:
- Degrees
- Competencies
- Memberships
- License and certificates
- Languages
- Honors and Awards
Tips to Configure for Profile Matching
To use Profile Matching properly, you need to configure the following:
- Enable Profile Matching under Functional Areas from the Generally Available Features tab on the Enable Features page. See Enable Generally Available Features.
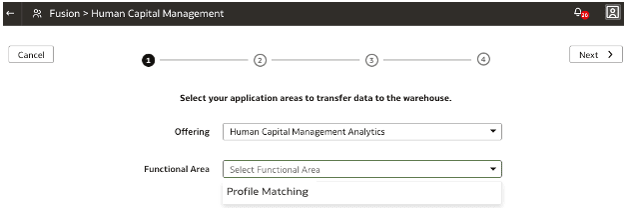
- Create a data pipeline for the Profile Matching functional area. While
creating the data pipeline, be sure to perform the following steps:
- Select Human Capital Management under Applications on the Console.
- In step 1 of the wizard to create a data pipeline, select
Human Capital Management Analytics in
Offering and Profile
Matching in Functional Area.
- In step 2 of the wizard to create a data pipeline, in
Number of desired matches, select an appropriate
value such as 100. Based on the chosen value, the application renders the
top number of matching profiles. For example, if you specify 100, then you
will see the top 100 matching profiles. If you want to match all profiles,
choose -1 for the number of desired matches.

Analyze Employee Profile Matching
Once the data load is complete, you can create a workbook and analysis based on the HCM – Profile Matching subject area.
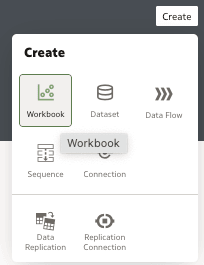
- Navigate to the Home page.

- Click Create, and click
Workbook..
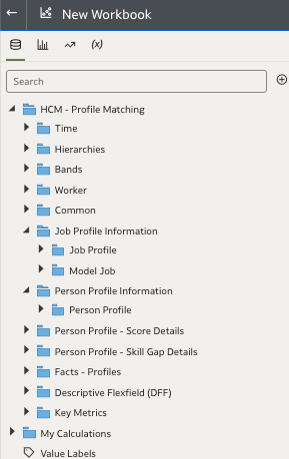
- In Add Data, search for "Profile Matching" and select HCM –
Profile Matching in the results.

- View the subject area details. The Profile Matching subject area
contains the worker’s basic information, profile information like job profile, model
profile, person profile, profile score details, and gap details in the folders
within it. You can make use of the
attributes and facts to create your visualization.
- Understand and report on the following business questions:
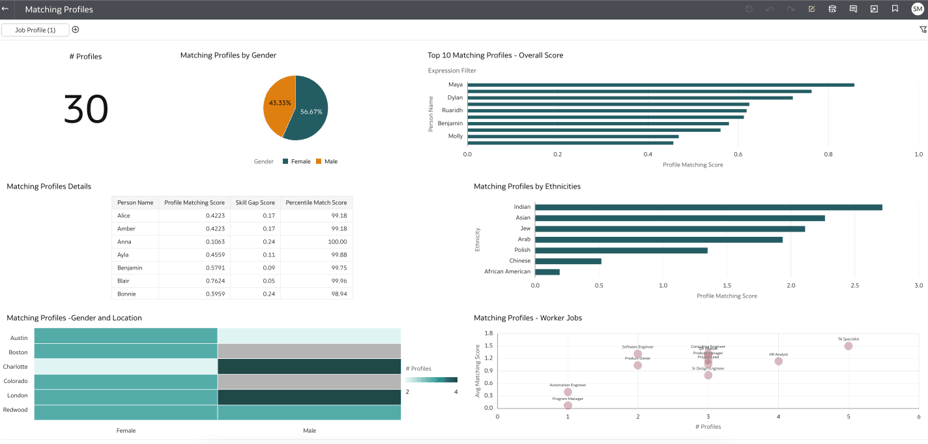
- Provide me the list of workers, their skills, and their qualifications that match a model job profile.
- Of the workers that have a lesser profile matching score, provide me the details of skills and qualifications gaps.
- Which are the top 5 jobs that a worker can transition into based on their profile scores?
- Can I analyze the matching profiles by their availability across various locations, their age and tenure bands, gender, and ethnicities?
Frequently Asked Questions
Review these questions to improve your understanding of the Profile Matching application.
-
How much data is needed for the Profile Matching model to be accurate?
HCM - Profile Matching can work with a limited set of data because it semantically matches an active worker’s talent profile to job profiles.
-
What algorithms does the Profile Matching prediction model use?
HCM – Profile Matching uses embedding-based matching on measures of similarity between vectors.
-
How frequently does the model create Profile Matching predictions on future data?
There are no predictions in HCM - Profile Matching as it analyzes existing data.
-
How frequently is the Profile Matching model calibrated or trained?
Most models are calibrated and trained weekly.
-
Are there any external benchmarks considered in the Profile Matching model?
No.