Define a Cross Tab Report
Cross tabs let you display report output in a table to summarize large amounts of data.
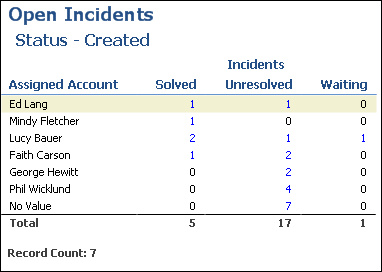
Using a cross tab table, you can select the fields to define the table’s rows, columns, and output fields, essentially grouping the data by both the row and column output. The output fields are a culmination of the row and column data. For example, if you had a report that returned the number of incidents assigned to each agent and the incidents’ statuses, you could designate the assigned account column as a row field, status as a column field, and number of incidents as a data field. The output would be similar to the sample report displayed in the following figure, which shows the number of incidents categorized by assigned staff member and status.
After you view your report data using the columns, rows, and output fields you define, you can select different fields to use as the columns, rows, and output fields. This lets you restructure the report to view groupings of different data, such as the number of incidents each staff member has, grouped by category instead of product. Without using cross tabs, the only way to retrieve these different summaries of data would be to use separate reports.