Creating a Media Discovery Report
You can use the media discovery report to find new audience categories that perform and behave similarly to those in the media campaigns you have run. To create a media discovery report, follow these steps:
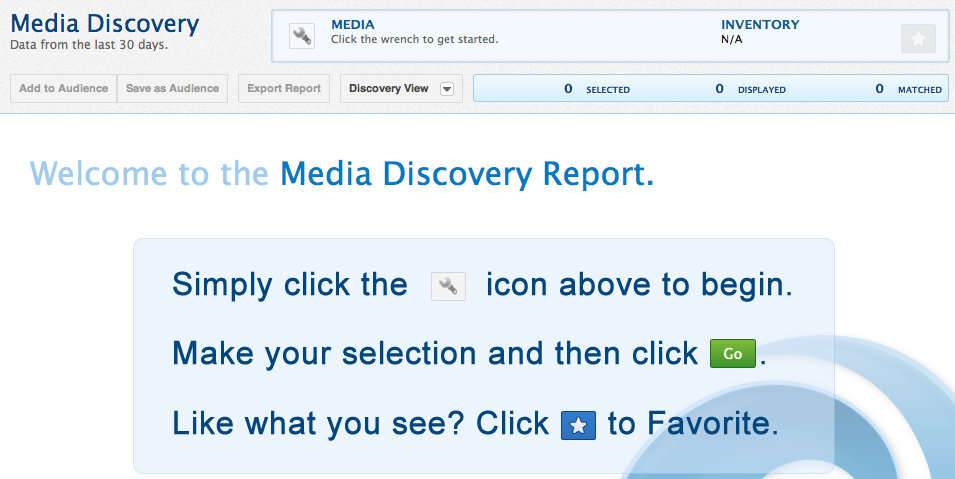
- Select Analyze > Media Discovery. The Media Discovery page is displayed.

- Click the Selector icon (
 ) or double-click anywhere in the Media query bar. The Media Report Query dialog opens.
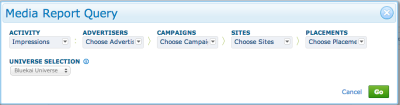
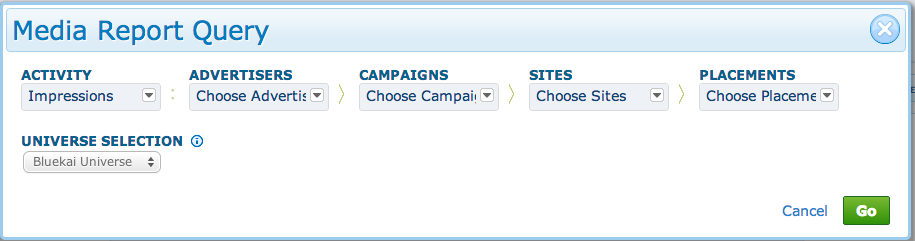
- Select any combination of Activity (clicks or impressions), Advertiser, Campaign, Site, or Placement to generate the report:
- Under Activity, select which media event to query: Clicks or Impressions.
- Under Advertiser, select which ad server to query.
- Under Campaigns, select which Oracle Data Cloud platform data campaign to query.
- Under sites, select the container/site to query.
- Under Placements, select which ad placement to query.
- Under Universe Selection, select the scope of your media report query. By default, your query considers the entire population of users; however, you can focus your audience query on the users in one or more of your audiences or containers (sites). Select one of the following options:
- BlueKai Universe: Your audience query considers all users.
- Audience: Your audience query considers one or more specified audiences. Select the check boxes for the audiences to be included in the query scope, and then click Update. Click Select All to include all of your available audiences in the scope. Click None to remove all of the selected audiences from the scope. To search for a specific audience, enter the name of the audience in the text box. The audiences are filtered as you type. To clear the filter, click Show All or delete the entered text. Click Show All to display all the available audiences. Click Show Selected to display only the audiences you have selected.
- Container: Your relative risk calculation: query considers one or more specified sites. Select the check boxes for the sites to be included in the query scope, and then click Update. Click Select All to include all of your available sites in the query scope. Click None to remove all of the selected sites from the scope. To search for a specific site, enter the name of the site in the text box. The sites are filtered as you type. To clear the filter, click Show All or delete the entered text. Click Show All to display all the available sites. Click Show Selected to display only the sites you have selected.
- Click Go. The media discovery report is generated.
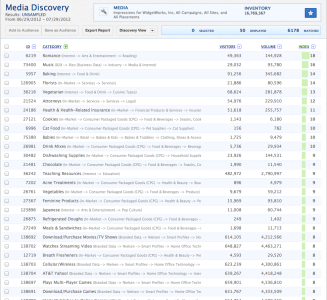
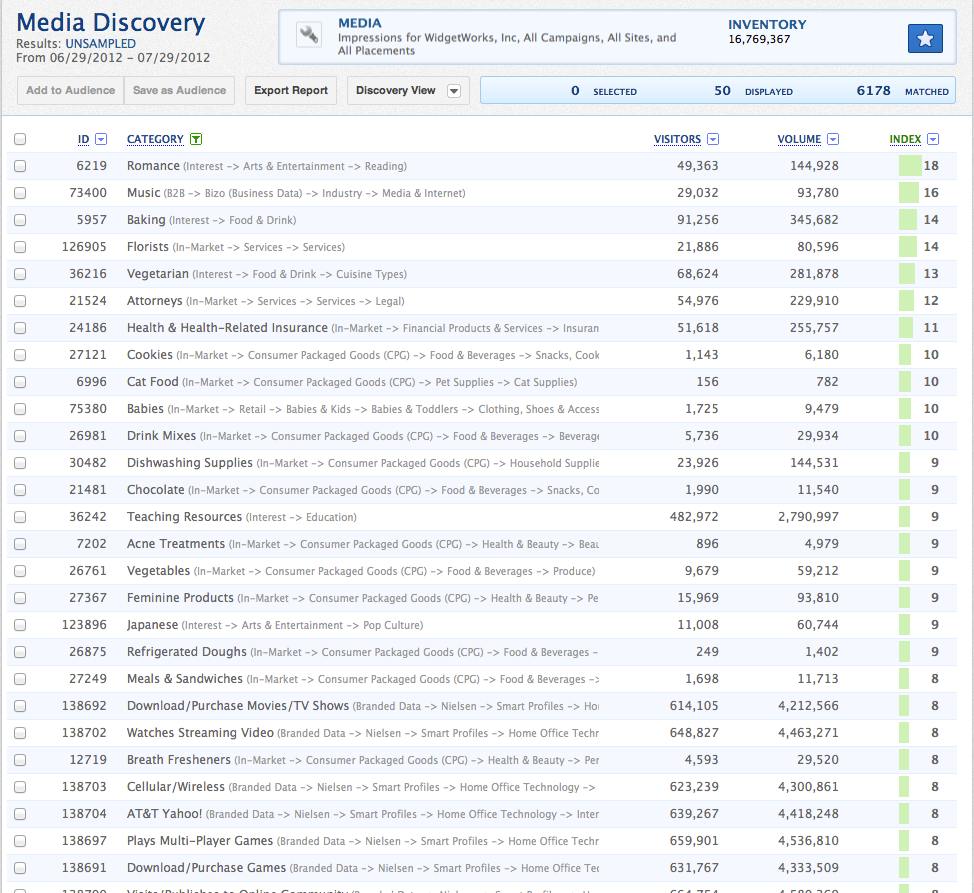
- The media discovery report lists the categories, sorted by the highest-indexing categories. If you cleared the Hide Audience composition check box, the categories from your queried Audience are included with an asterisk * appearing next to the category name. Use the pagination tool at the bottom of the report to view additional pages of the report. The report lists the following information.
Property Description Inventory The number of unique users the platform has seen in the queried audience over the last 30 days. ID The unique ID assigned to the category. Category The name (and taxonomy path) of the category. Visitors The overlap between your queried segment and this category over the last 30 days, which displays how many users you're already targeting. Visitors is always an integer. Volume The number of unique users the platform has seen in this category over the last 30 days, which forecasts how many users are potentially available to target. The difference between Volume and Visitors for a given category shows you how many new users you can reach with this category. The volume is always an integer. Index The Index states that a person in query X is n times more likely to be in the category than another user in the selected universe (the entire BlueKai population, a set of one or more audiences, or a set of one or more containers) . The higher the index, the more alike the category is to your query. Formula:Click the
# of users from query X in the category (Visitors) / # of users in query X (Inventory)
-------------------------------------------------------------------------------------------------------------------------
# of BK users in the category (Volume) / # of total users in the selected universe (Universe)Example:
A report queries an audience containing your site converters (Inventory = 1 million), and focuses the query on an audience containing all of your site visitors (Universe = 5 million). If the overlap between the queried audience and a sample category (Visitors) is 50,000, and the total number of users in that category (Volume) is 60,000, the index would be 4. This means that, in this example, a site converter is 4 times more likely to be in the sample category than a site visitor.
50,000/1,000,000 0.05
------------------------ = ------- = 460,000/5,000,000 0.012
Note: If you selected Mobile Devices Only in the query but the inventory numbers in the report are "0" or "unknown", contact My Oracle Support (MOS) to set up a Mobile Media Audience Analytics onboard.
- To include or exclude certain types of categories, like Geographic, or Demographic categories, or to remove the categories from the queried audiences, click the green filter icon to the right of the Category column. Select the verticals you want to include in the report. Optionally, select the Hide Audience Composition check box to hide the categories in the queried audience, which are marked with an asterisk (*). Click Apply to update the report based on the selected filters.
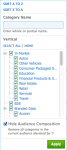
Tip: You can use the Category Name search box to find certain categories. To exclude categories from the audience you are using as a basis for discovery, click the Hide Audience Composition check box.
- To filter or sort the report results:
- Click the filter icon in any column to filter or sort the results. The Visitors, Volume, and Index columns have sliders to adjust the value.
- To specify a specific value, click on the value at either end of the filter and type your own value. For example, if you want the visitor range to be above 50,000,000 in the following example, click the 6,000 and type 50,000.
Click Apply to filter the data.
Tip: After you sort and filter the media discovery report, click the Mark as Favorite icon (
 ) to bookmark your report as a favorite. When you reopen the report, it will still use the same sorting and filtering. If you update the sorting and filtering in a saved report, click the Mark as Favorite icon (
 ) to save your changes
- To add categories to an existing saved audience, or create a new audience, see creating an audience profile report.
- To save the media discovery report as a favorite, and generate sampled and unsampled reports from it, click the mark as favorite icon (). In the Save New Favorite dialog, select whether to use sampled or unsampled data, optionally enable and configure the Email Settings to email your report to one or more recipients, and then click Save. See using favorite reports.
Tip: When you save a report as a favorite, you can include it and up to three other reports in a comparison report. Comparison reports enable you to instantly analyze your audiences across product lines, media events, and media execution platforms in a single consolidated view. See comparing favorite reports.
- Click Export Report to export the media discovery report to a CSV file.