Properties Changed
The Properties Changed card displays visualizations of the properties that were updated the most by your users.
For details on the actions that you can take in the dashboard panels, see Working with Dashboard Panels.
Most Updated Properties

The Most Updated Properties dashboard panel displays the properties (up to the top 100) with the highest total change count as determined by your page filter. The visualization is presented as a tag cloud, with properties with more changes displayed in bigger font sizes. The properties are also displayed in a table with the total change count for each property.
From the tag cloud, you can drill down to view the transaction history for a particular property, drill across to view the changes for that property in another visualization, or apply the specifics of that property to the page filter (see Working with Dashboard Panels).
From the table, right-click a column to resize it or to change the sort order.
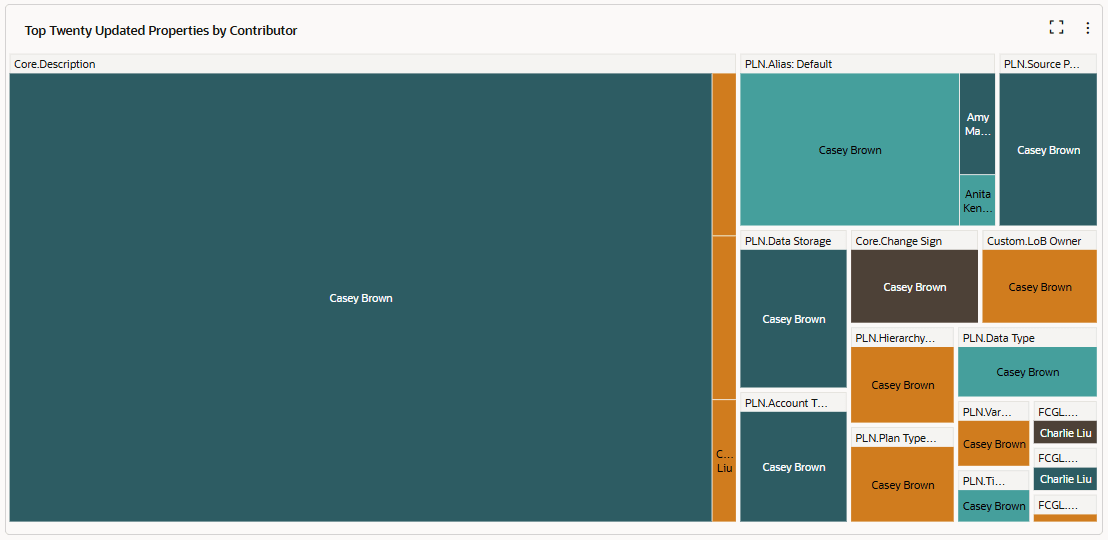
Top Twenty Updated Properties by Contributor

The Top Twenty Updated Properties by Contributor dashboard panel displays the top twenty properties that have been updated per contributor in a treemap chart. Each segment of the chart represents the changes to a specific property by a specific user, with bigger segments representing greater numbers of changes.
From a segment for a specific property, in the property header click
Maximize
![]() to display the treemap for that property only. Click
Restore
to display the treemap for that property only. Click
Restore
![]() to display all of the properties again.
to display all of the properties again.
For each segment in the chart, you can drill down to view the transaction history, drill across to view the changes in another visualization, or apply the specifics of that segment to the page filter (see Working with Dashboard Panels).