About Chart Designer
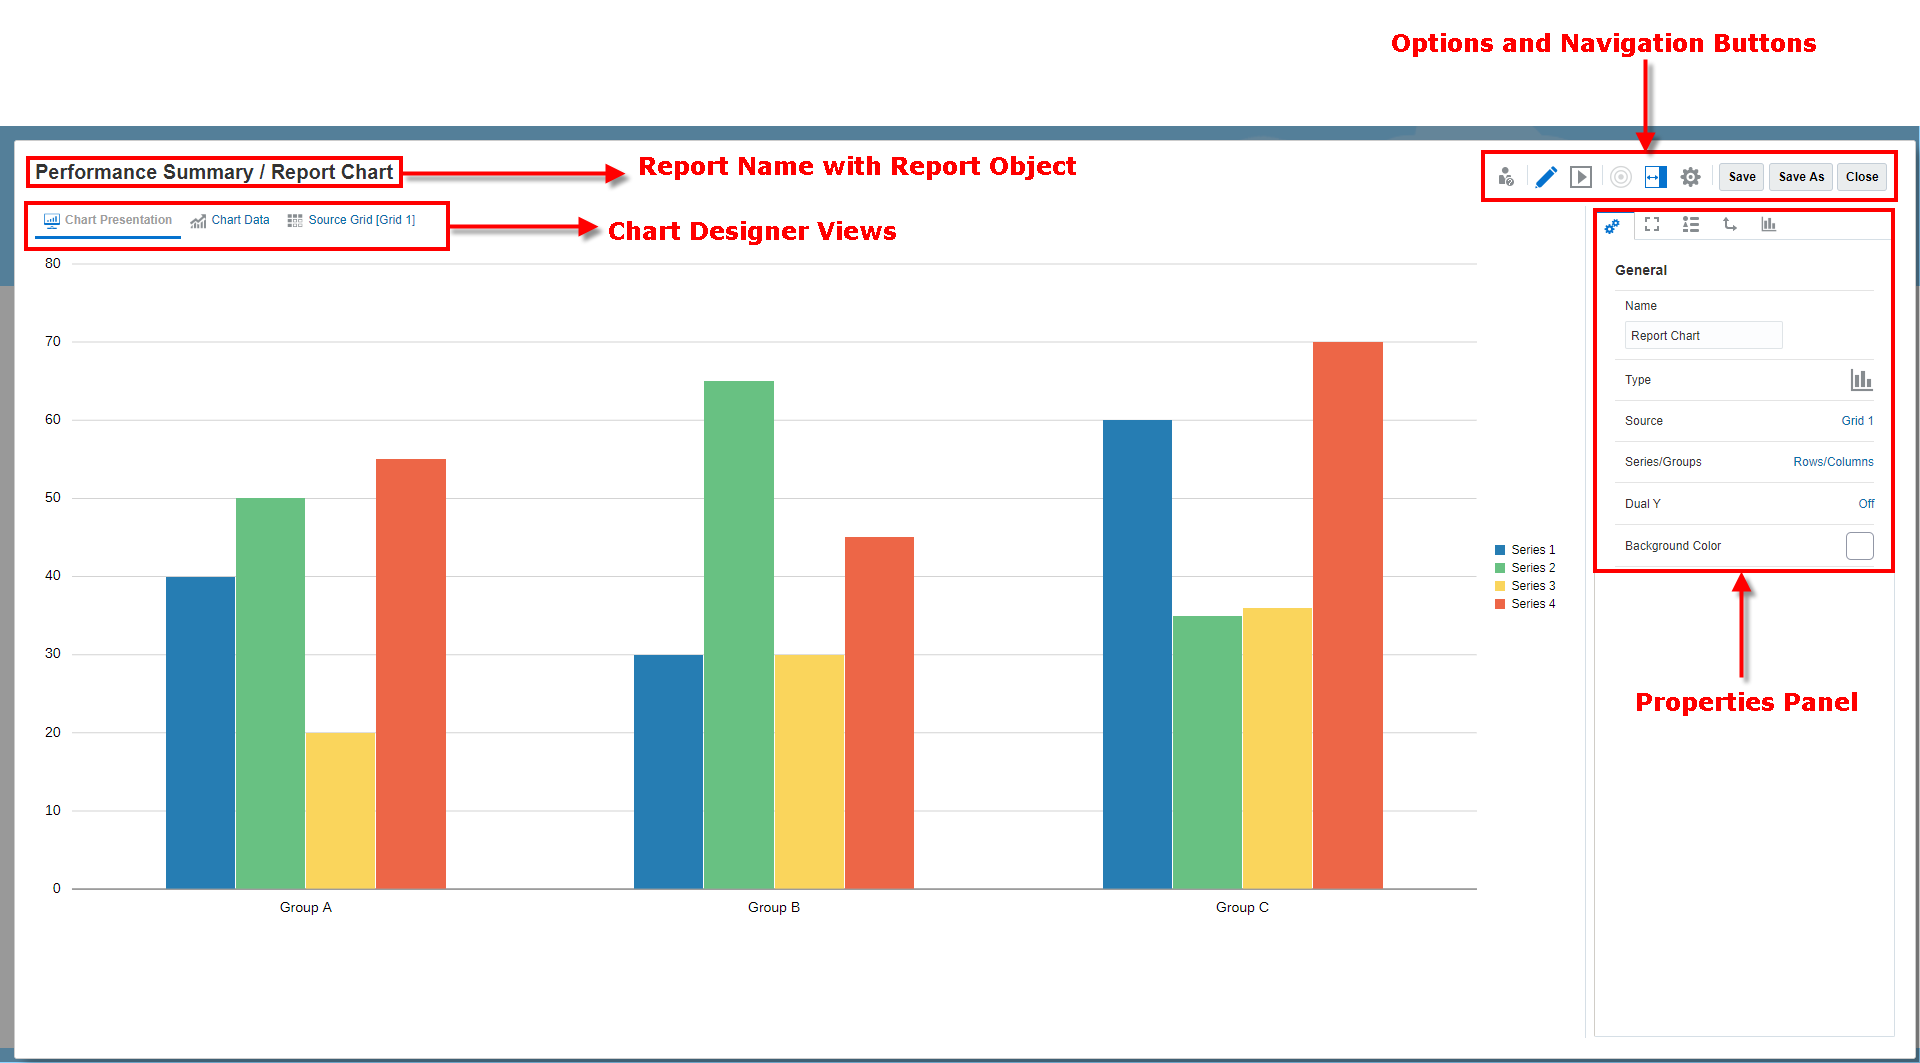
The chart designer has different areas to use for look and feel in a report.
The chart designer has the following areas:

-
The Views tabs enable you to toggle between chart presentation, chart data, and source grid views. See Chart Designer Views
-
The Properties panel displays general, plot area, title, axis, and legend properties, as well as display options for each data set in a chart. See Chart Properties
-
The toolbar lets you switch between edit and preview modes, show or hide the properties panel, and select a different report object to edit.