About Gauge Charts
This section describes the use of the gauge chart type, which enables you to identify the data values within the specified range; you can compare data values to fall under the maximum or minimum range.
Gauge Charts
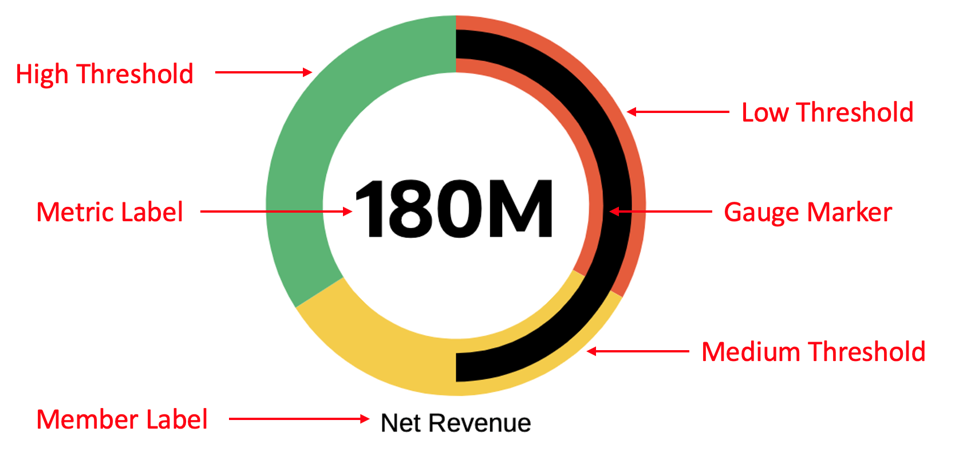
Gauge chart types show you whether data values fall within an acceptable range or not. You set the minimum and maximum values, the range maximums, and the gauge by default uses Red, Yellow, and Green traffic lighting to help you quickly assess a current value and identify problems in important data points or measures. You can select Circular, Horizontal, and Vertical gauge types.
For the gauge markers, you can either use thresholds, reference lines or no markers. You can also customize the chart threshold colors, labels and other items in Chart properties.
Examples of circular, horizontal and vertical gauge charts

Gauge Chart Components

Each gauge chart displays a single cell from the underlying Reports grid. The selected cell is defined in Chart Data in the chart editor. If multiple cells are selected in Chart Data, the first cell is used for the chart. For multiple gauges to display different cells of data, you create multiple gauge charts and select different cells for each one in Chart Data. Depending on the data intersections, you can use a single grid to drive the multiple gauge charts.
There are two options to specify the Low, Medium, and High thresholds. Note that the high threshold is set as part of the maximum. The Percent type is the default and provides and initial automatic calculation of the thresholds, which will also adjust the thresholds with changes in data values, for example with end user POV changes. The Value type uses hard-coded numbers for the thresholds; these values remain static with any changes in data values.
To change between the two types, you set the Maximum Value type in the Gauge Chart properties; you set the Low and Medium threshold types in the Threshold Type property in the Thresholds Chart properties.
- Percent:
- For the maximum (high threshold), the default selection is Percent of Metric value with a default value of 200%. This is set in the Gauge Chart Property for Maximum Value.
- For the Low and Medium thresholds, the default is Percent of Maximum value, with default values of 33% and 66% for the low and medium thresholds, respectively. This is set in the Thresholds Chart properties.
- The percentage results are calculated and applied at run time based on the metric value.
- Value: You can manually set the maximum (high threshold) as well as the low and medium thresholds by entering a value for each. You set the maximum in Gauge Chart Properties and low and medium thresholds in Thresholds Chart properties.