Example: Treemap and Sunburst Charts
Let’s look at examples of each chart type and their related properties and colors. Both examples use a grid design with the following row member selections for the Segments dimension:
Descendants of Seg01 (Inclusive), excluding Gen 6; Descendants of Seg02 (Inclusive)
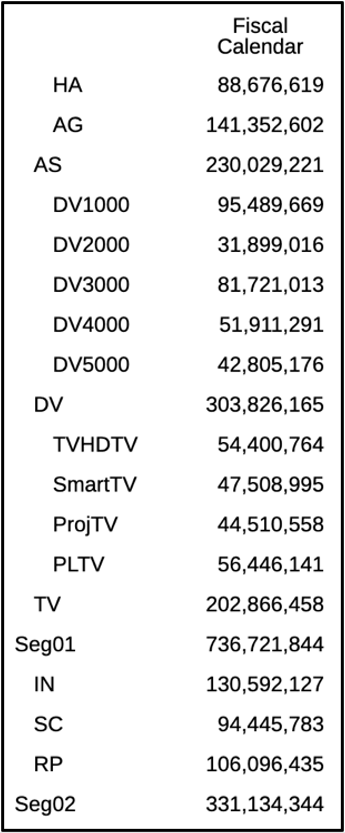
Here is the grid preview.
Note the indented list of the descendants of Seg01 and Seg02:
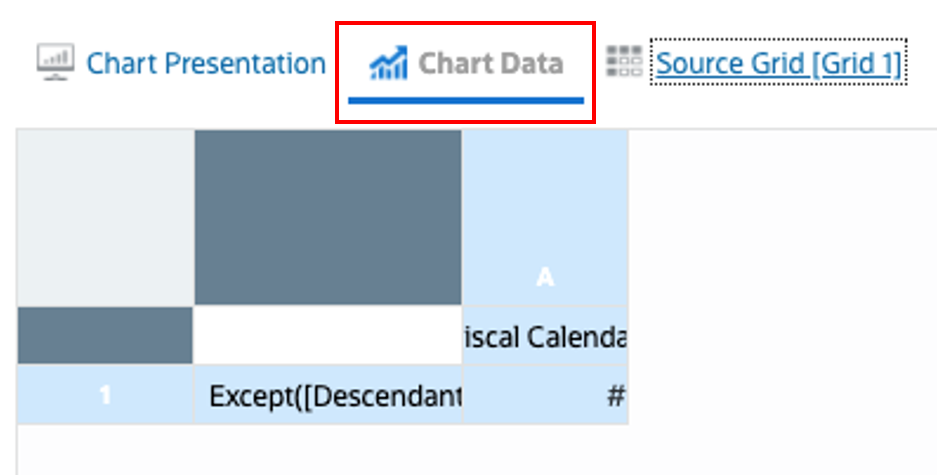
Here is the Chart Data selection for both chart types:
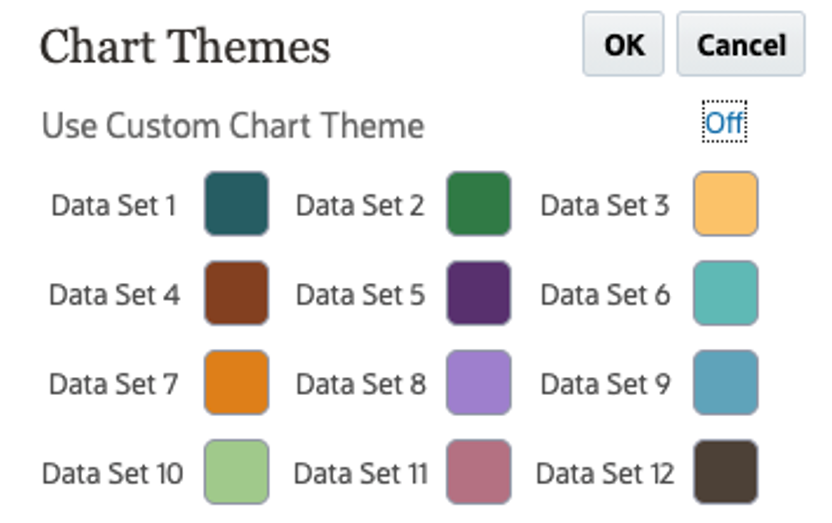
Here are the Default Chart Colors which will be displayed in the example:
Treemap Chart
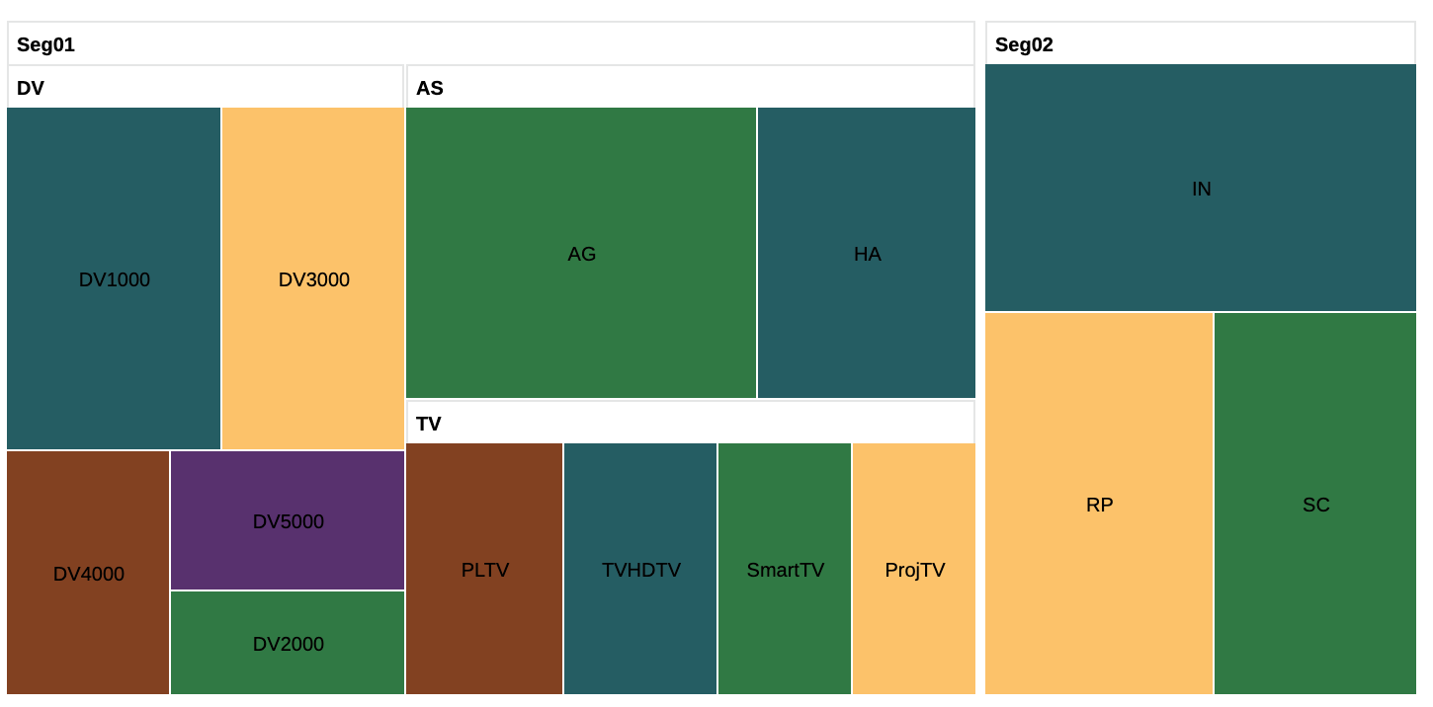
Based on the above grid definition and Chart Data selection, the following is a preview of the Treemap chart:
Note:
-
All the level 0 members are plotted as rectangles, the size of the rectangles reflects the data values of each element in proportion to the other elements.
-
All parent members are represented as rectangles, grouping their children within it.
-
The leaf node rectangles have colors based on the Data Set colors and their position in the hierarchy. HA and AG are children of AS. HA is the first child, so it has the color for Data Set 1. AG is the second child with the color for Data Set 2, so on.
Treemap Properties
The Treemap chart has the following Tree-specific properties:
Table 8-2 Tree Options
| Field | Description |
|---|---|
|
Layout |
|
|
Label Location |
Display within the Node, or Off (don’t display labels). |
|
Format |
Format the text displayed for the node labels. |
|
Horizontal Alignment |
Alignment for the node labels: Center, Start or End. |
|
Separators |
Separators between the node boxes: Gaps or Bevels. |
|
Tooltip Number |
Tooltip number formatting for the underlying numerical data value. |
Table 8-3 Header Options
| Field | Description |
|---|---|
|
Background Color |
Background color for the header rectangles. |
|
Border Color |
Border color for the header rectangles. |
|
Use Node Color |
Use the node color for the header rectangles. |
|
Format |
Format the text displayed for the header labels. |
|
Horizontal Alignment |
Alignment for the header labels: Center, Start or End. |
Sunburst Chart
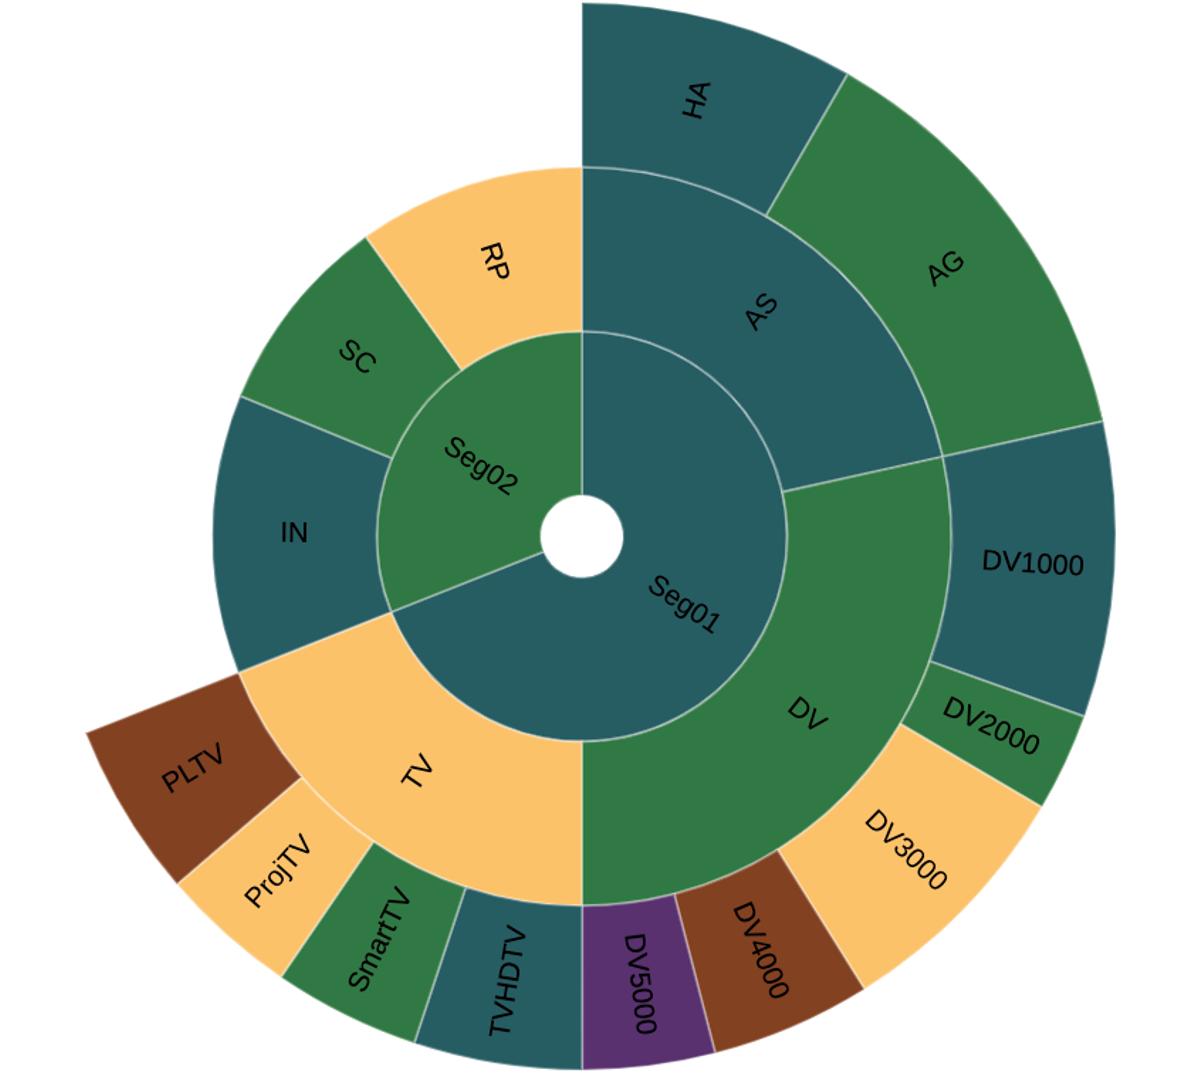
Based on the above grid definition and Chart Data selection, the following is a preview of the sunburst chart:
Note:
-
All the member elements are plotted as slices; the size of the slices reflects the data values of each element in proportion to the other elements.
-
Each level of the hierarchy is represented by a circle or ring with the innermost ring representing the top of hierarchy data and the outermost ring represents the leaf nodes of the hierarchy.
-
Seg01 and Seg02 have their slice colors based on Data Set 1 and Data Set 2, respectively. AS, DV and TV are the three children of Seg01, and each has its color based on its position in the hierarchy based on Data Set 1, 2 and 3.
Sunburst Properties
The Sunburst chart has the following sunburst-specific properties:
Table 8-4 Sunburst Options
| Field | Description |
|---|---|
|
Sorting |
Sunburst nodes can be sorted based on the numerical values. You can turn sorting On or Off. |
|
Start Angle |
Set the angle where the outer node element plotting starts; the default is 90 degrees. |
|
Label Location |
Set either: Auto, Horizontal, Off or Rotated. |
|
Format |
Format the text displayed for the slice labels. |
|
Border |
Enable or disable a border between each slide, and set the border color, if enabled. |
|
Tooltip Number |
Tooltip number formatting for the underlying numerical data value. |
Considerations for both Treemap and Sunburst Charts
Based on the chart size, the number of elements, and font size, the member label display in the chart elements may be truncated due to the automatic label sizing of the charting engine.
If you experience truncated labels, it is recommended that you do one or more of the following, if possible:
-
Shorten the member labels by either using member names or custom labels instead of member labels.
-
Reduce the font size.
-
Increase the chart size.