Point of View Examples
The following examples illustrate how global and local POV work together in grids, and how the POV options affect the grid display.
Example 1: Two Grids with the Same Data Source
Figure 4-10 Preview: Grid 1 and Chart 1
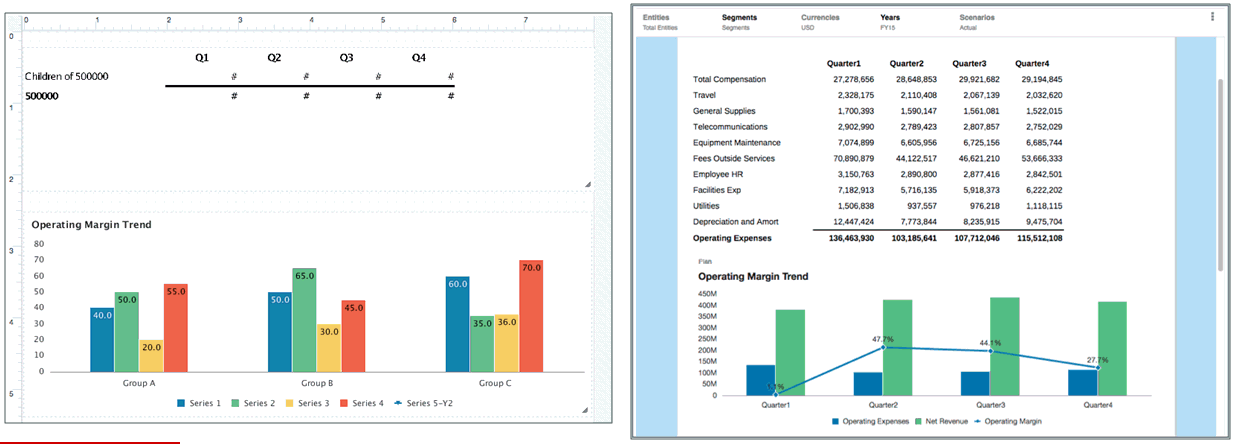
In this example, the report contains one grid and one chart, which uses a second embedded grid. Figure 4-10 shows the grid and chart in preview mode.
Figure 4-11 Example 1, Grid 1: Design Mode

Figure 4-11 shows grid 1 in design mode. Note the following:
-
All dimensions are Global.
-
Entities, Currencies, and Scenarios are single selections with Display Suggestions Only enabled.
-
Segments is set to Default.
-
Years has multiple selections with Display Suggestions Only enabled.
Figure 4-12 Example 1, Grid 1: Preview Mode
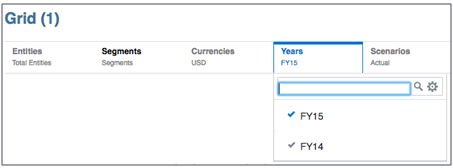
Figure 4-12 shows Grid 1 in preview mode. Note the following:
-
Entities, Currencies, and Scenarios: viewer cannot change selections.
-
Segments: viewers can select any member.
-
Years: viewers can select only from the two members defined.
Figure 4-13 Example 1, Chart 1: Design Mode

Figure 4-13 shows Chart 1 in design mode. Note the following:
-
Scenarios is set to local, with a single selection only (Plan). Display Suggestions Only is enabled.
-
The remaining selections are set from the global POV.
Figure 4-14 Example 1, Chart 1: Preview Mode

Figure 4-14 shows Chart 1 in preview mode. Note that Scenarios is displayed in the local POV, and cannot be changed.
Example 2: Two Grids with Different Data Sources
Figure 4-15 Preview: Two Grids with Different Data Sources

In this second example, the report contains two grids with different data sources. Grid 1 has an Narrative Reporting data source. Grid 2 has an Planning Modules data source.
The Entity and Scenarios dimensions are common across both data sources.
Figure 4-16 Example 2, Grid 1: Design Mode

Figure 4-16 shows Grid 1 in design mode. Note the following:
-
The Entity dimension is local; all others are global.
-
Years, Segments, and Currencies are set to Default, with Display Suggestions Only disabled.
-
Scenario has multiple selections, and Display Suggestions Only is enabled.
-
Entity has one selection (Total Entities), with Display Suggestions Only disabled.
Figure 4-17 Example 2, Grid 1: Preview Mode
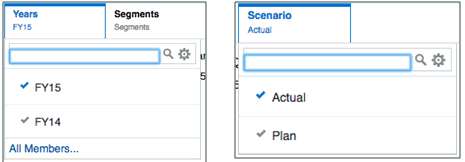
Figure 4-17 shows elements of Grid 1 in preview mode. Note the following:
-
For Years, Segments, and Currencies, viewers can select any members. Recent members are displayed
-
For Scenario, viewers can select only from the two members that were defined.
-
For Entity, viewers can select any member. Total Entities is displayed.
Figure 4-18 Example 2, Grid 2: Design Mode

Figure 4-18 shows grid 2 in design mode. Note the following:
-
The Entity dimension is local; all others are global.
-
HSP_View, Year, Version, and Product each have one selection, with Display Suggestions Only enabled.
-
Scenario has multiple selections, with Display Suggestions Only enabled.
-
Entity has multiple selections, with Display Suggestions Only disabled.
Figure 4-19 Example 2, Grid 2: Preview Mode

Figure 4-19 show Grid 2 in preview mode. Note the following:
-
For HSP_View, Year, Version, and Product , the viewers cannot change the selection.
-
For Scenario, viewers can select only from the two defined members. .
-
For Entity, viewers can select any member. "Entity" is displayed when the grid is previewed.
Figure 4-20 Example 2: Report Preview
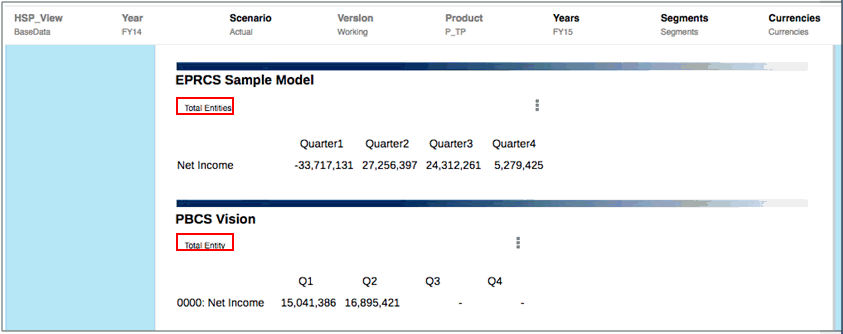
Figure 4-20 shows a preview of the report with both grids. Note the following:
-
The common dimension names are Entity and Scenario.
-
The combined POV when previewing contains the following:
-
The global POV for Scenario drives both grids.
-
The local POV for Entity in each grid has a different selection.
-
Years, Segments, and Currencies for Grid 1 can be changed.
-
HSP_View, Year, Version, and Product for Grid 2 cannot be changed.
-
Example 3: Two Grids with Different Data Sources and Multiple Selections in Common Dimension
Figure 4-21 Preview: Two Grids with Multiple Selections in a Dimension

In this third example, a report contains two grids with different data sources. Grid 1 has an Narrative Reporting data source. Grid 2 has an Planning Modules data source.
The Entity and Scenarios dimensions are common across both data sources. In addition, the Scenario dimension uses a member selection function to return multiple members.
Figure 4-22 Example 3, Grid 1: Design Mode
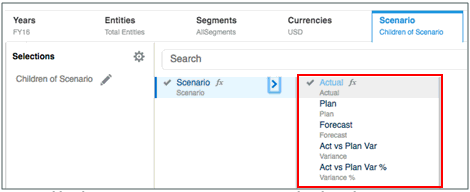
Figure 4-22 shows Grid 1 in design mode. Note the following:
-
All dimensions are global.
-
Years, Segments, Currencies, and Entity have one selection each, with Display Suggestions Only enabled.
-
Scenario has a member selection function:
Children(Scenario). Display Suggestions Only is enabled.Note:
Notice that there are five members listed for Scenario: Actual, Plan, Forecast, Act vs Plan Var, and Act vs Play Var %.
Figure 4-23 Example 3, Grid 1: Preview Mode
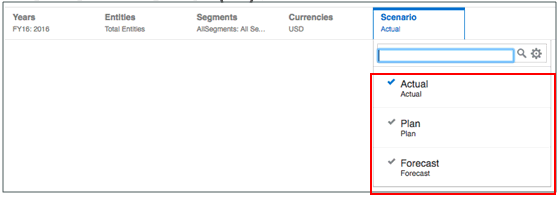
Figure 4-23 shows Grid 1 in preview mode. Note the following:
-
For Years, Segments, Currencies, and Entity, viewers cannot change the selection.
-
For Scenario, only the common members between the two data sources are listed. Even though there are five members available for this data source, only the three members that are common to both data sources are available: Actual, Plan, and Forecast.
Figure 4-24 Example 3, Grid 2: Design Mode
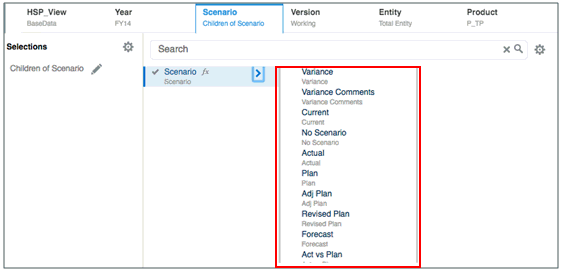
Figure 4-24 shows grid two in design mode. Note the following:
-
HSP_View, Year, Version, Product, and Entity all have one selection each, with Display Suggestions Only enabled.
-
Scenario has a member selection function:
Children(Scenario). Display Suggestions Only is enabled.Note:
Notice that there are ten members listed for scenario: Variance, Variance Comments, Current, No Scenario, Actual, Plan, Adj Plan, Revised Plan, Forecast, and Act vs Plan.
Figure 4-25 Example 3, Grid 2: Preview Mode
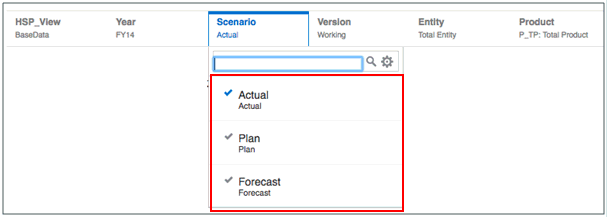
Figure 4-25 shows grid 2 in preview mode. Note the following:
-
For HSP_View, Year, Version, Product, and Entity, viewers cannot change the selection.
-
For Scenario, only the common members between the two data sources are listed. Even though there are ten members available for this data source, only the three members that are common to both data sources are available: Actual, Plan, and Forecast.
Figure 4-26 Example 3: Report Preview

Figure 4-26 shows a report preview with a common POV. Note the following:
-
Scenario is the only dimension that can be changed by a viewer.
-
Only the Scenario members that are common to both data sources are able to be selected: Actual, Plan, and Forecast.