Working with the Generative AI Sample Reports
Narrative Reporting includes seven Generative AI (GenAI) sample reports, one for each of the three use cases for generating narrative summaries and four for Notes summarization. This topic reviews the report design and resulting report output.
For more information on deploying the Narrative Reporting samples, see Installing Samples in Administering Narrative Reporting .
Note:
The generated narrative text for the sample reports may slightly differ between runs, the text can also differ if the machine learning property files have been edited. The generated narrative text in the sample report screenshots below may differ from when you run the report on your Narrative Reporting instance.
About Sample Report 13a (GenAI - Describe Exception)
This report contains one simple grid with regions (Entities) in the rows with Actual, Plan, and Variance in the columns, with a hidden "Percent of Sales" formula column, and a text box in the report to display the GenAI narrative summary. The purpose of the narrative summary is to describe an exception as specified in the conditional text definition, which is a percent of Sales over 10% of total and a negative Variance.
Grid Design View: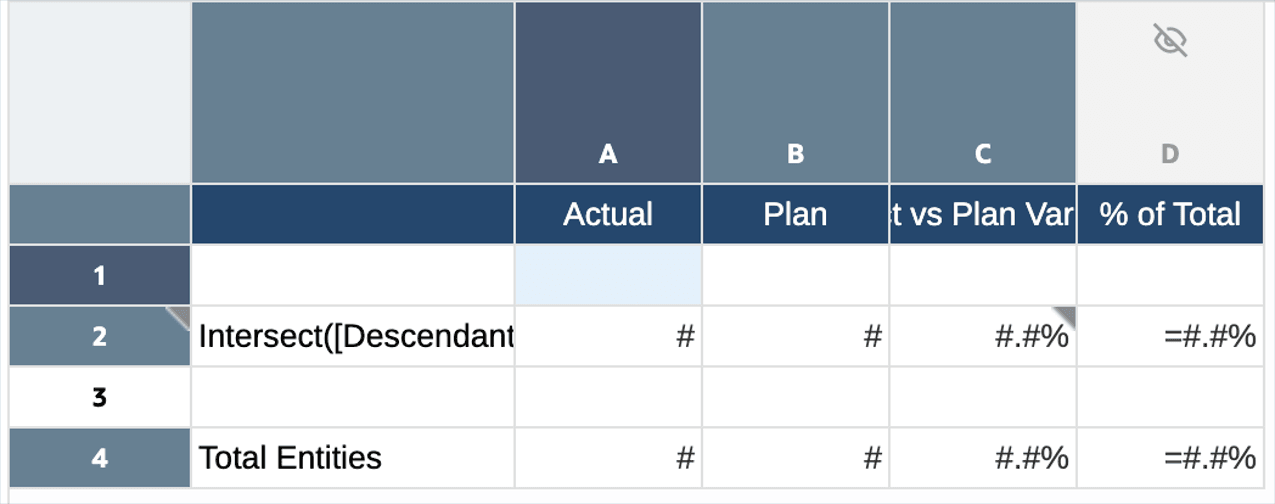
The conditional text is applied to all Entity rows, except for the Total Entities and to the Variance column. The condition is defined as follows:

Where if the Percent of Sales (Column D) is greater than
10% AND the Variance (Column C) is negative, the
background color for the variance data cell will be set to Gray (not shown in
the screenshot) and the AutoTextSummary() function is inserted
into the Conditional Text panel on the right.
Note that since the use case is "Describe Exception", the Summary Type parameter for the text function is left blank.
Previewing the Report:
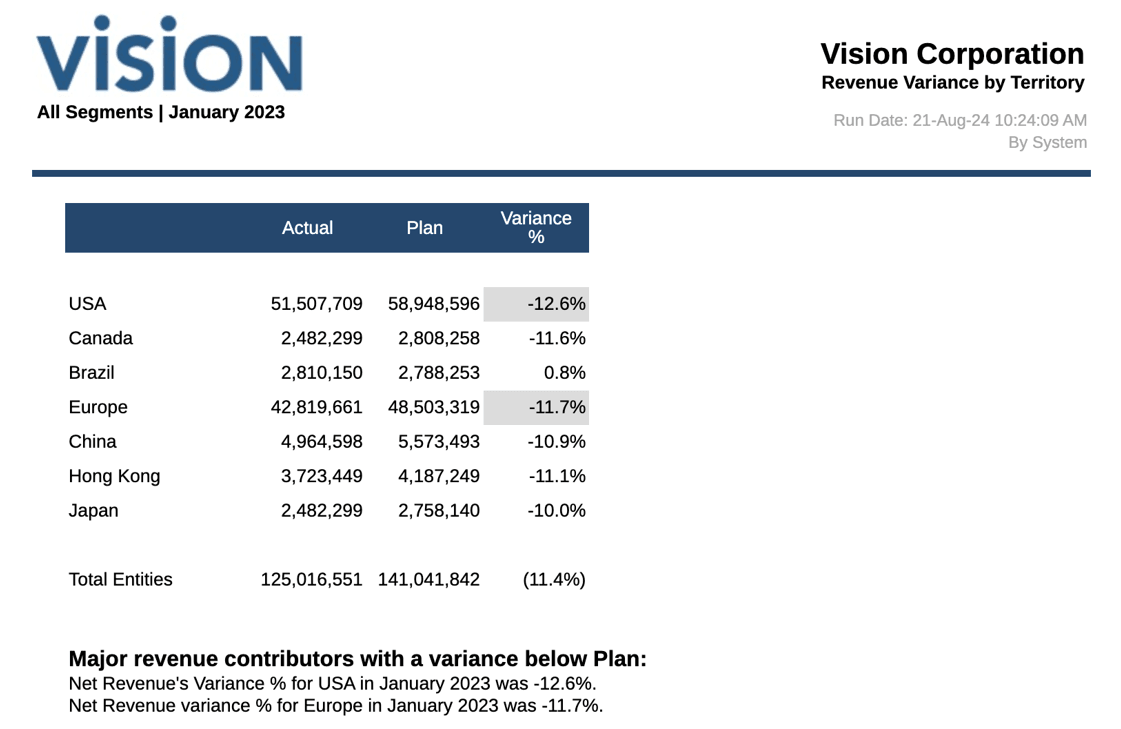
When executing the report, based on the examples in the machine learning property files, the results are as follows, where the USA and Europe "Percent of Sales" values AND the negative Variance meet the defined conditions, hence the data values are colored gray and the conditional text in the text box below the grid used GenAI to describe the exceptions.
About Sample Report 13b (GenAI - Comparative Analysis)
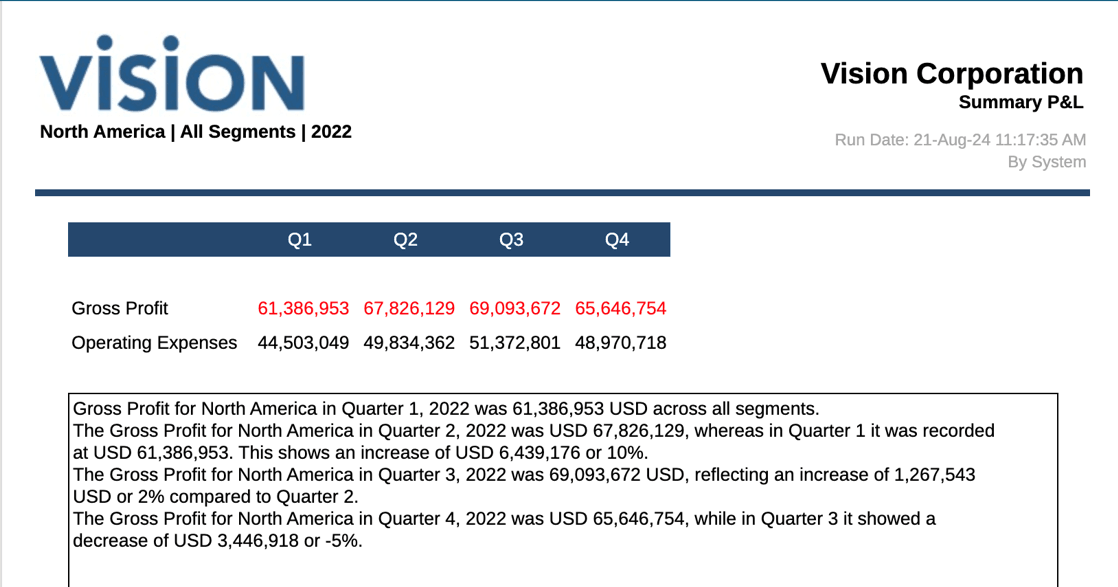
This report contains one simple grid with two summary P&L accounts across four quarters, and a text box to display the GenAI narrative summary. The purpose of the narrative summary is to do a comparative analysis between Q1 through Q4 as specified in the conditional text definition.
Grid Design View: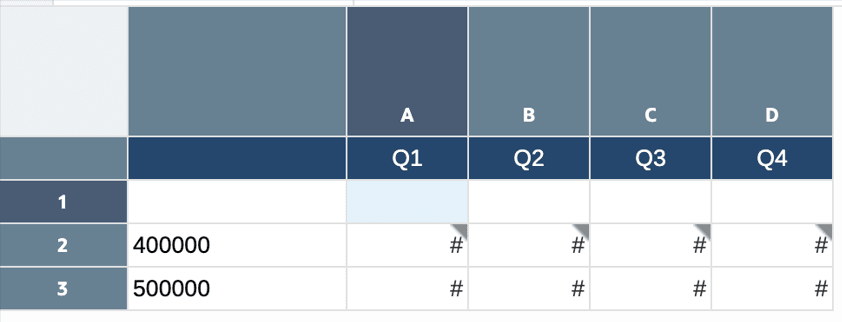
The conditional text is applied to the Gross Profit row and to all four quarter columns. The condition is defined as follows:

Where if the cell value is not equal to zero, the text font color will be set to
Red (not shown in the screenshot) and the
AutoTextSummary(COMPARE) function is inserted into the
Conditional Text panel on the right.
Note that since the use case is "Comparative Aanalysis", the Summary Type parameter for the text function is set to "COMPARE".
Previewing the Report:
When executing the report, based on the examples in the machine learning property files, the results are as follows, where the Gross Profit data values in Q1 through Q4 meet the "value is not equal to zero" condition, hence the data values are colored red and the conditional text in the text box below the grid used GenAI to describe the exceptions.
About Sample Report 13c (GenAI - Causality for Exceptions)
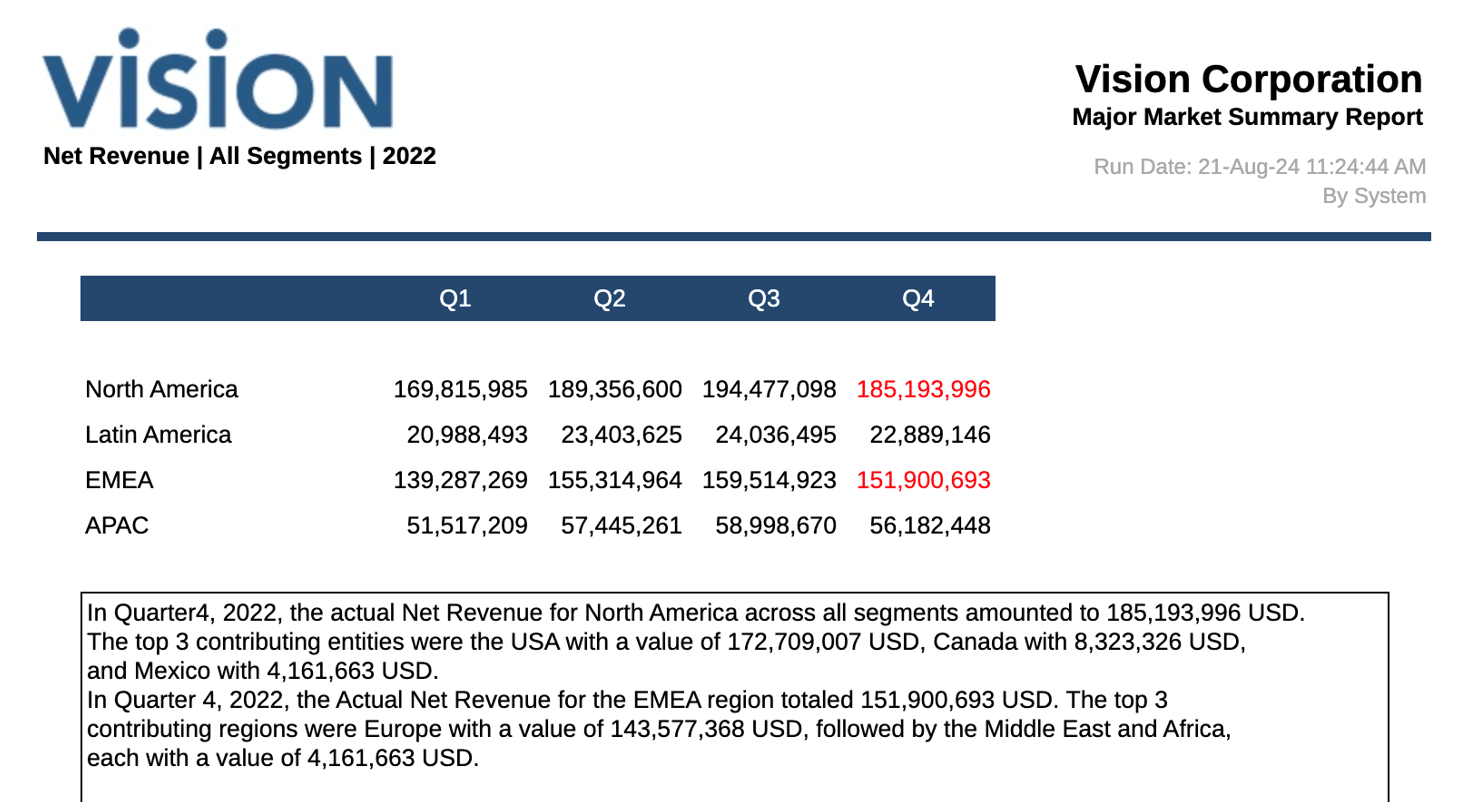
This report contains one simple grid with Entity region members in the rows across four quarters with Net Revenue as the Account POV, and a text column to display the GenAI narrative summary. The purpose of the narrative summary is to "Describe a Causality for Exceptions" as specified in the conditional text definition.
Grid Design View:
The conditional text is applied to all Entity rows and the Q4 column. The condition is defined as follows:

Where if the cell value is greater than 120,000,000, the text font color will
be set to Red (not shown in the screenshot) and the
AutoTextSummary(ZOOM) function is inserted into the
Conditional Text panel on the right.
Note that since the use case is "Causality for Exceptions", the Summary
Type parameter for the text function is set to "ZOOM". Specifically the
text function parameters for this sample are as follows:
AutoTextSummary(ZOOM, 5, LEVEL, 0), where:
- 5 is the top/bottom number, which defines the number of contributors that are returned in the result.
- LEVEL means that a level number will be used to return the result.
- 0 is the level number that will be used to return the result.
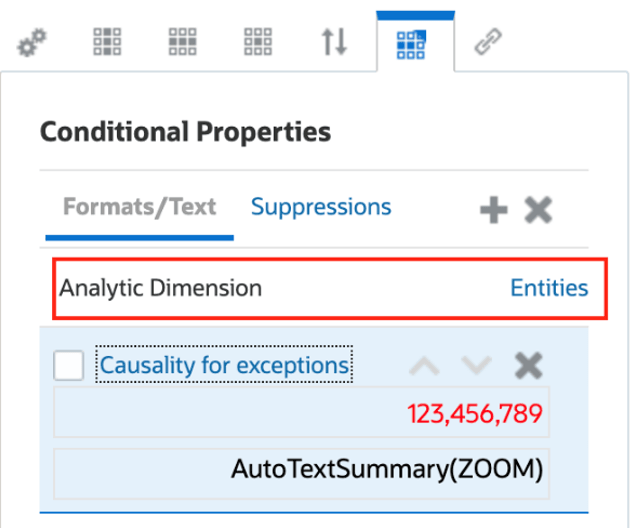
In addition, under Conditional Properties, the Analytic Dimension is set to Entities since this is the row dimension in the grid that needs to be analyzed.
Previewing the Report:
When executing the report, based on the examples in the machine learning property files, the results are as follows, where the North America and EMEA data values in Q4 meet the "value is greater than 120,000,000" condition, hence the data values are colored red and the conditional text in the text box below the grid used GenAI to describe the exceptions.
About Sample Reports 15a – 15d
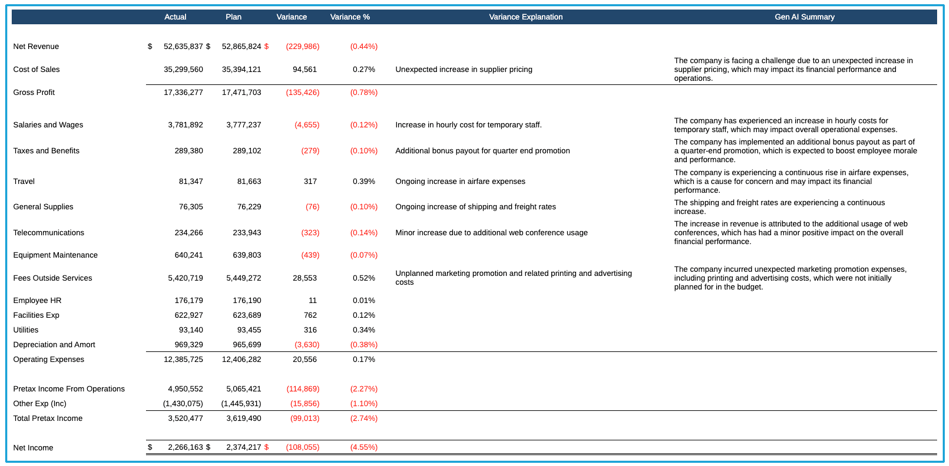
These reports illustrate the Generative AI-based summarization of Notes. All four reports contain the same grid layout, with Income Statement accounts in the Rows and Scenarios with associated variances in the columns. Additionally, there is a Note column for Variance Explanation that contains commentary for some of the account rows.
Grid Design View: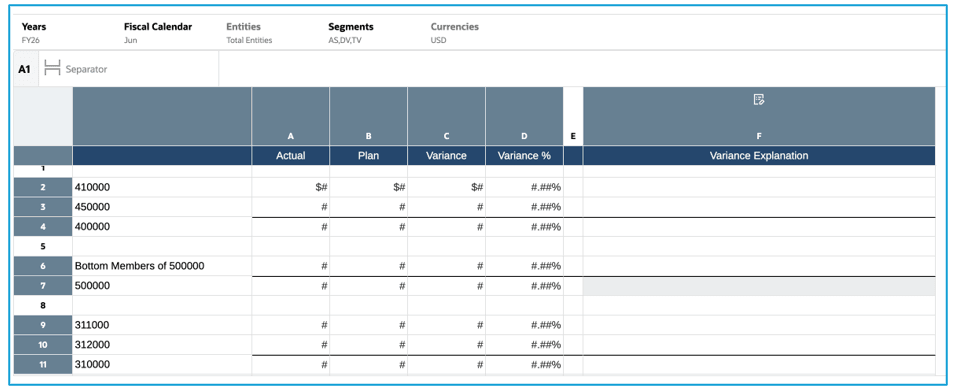
Grid Partial Preview: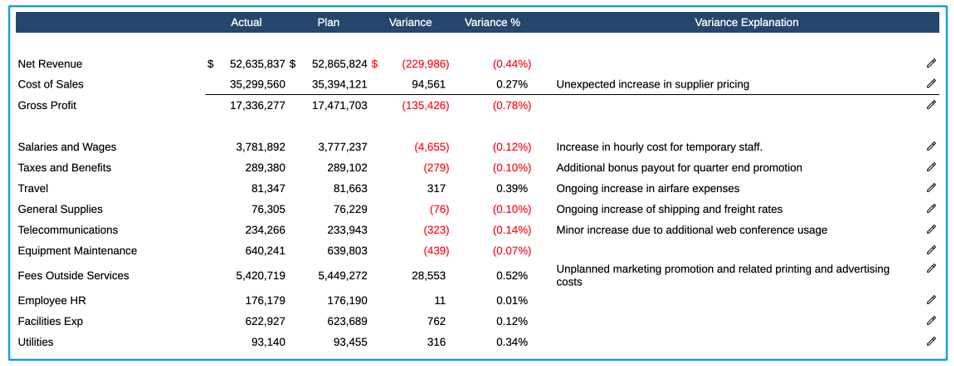
Sample Report 15a (Gen AI Notes End User)
This report illustrates how end users can summarize Notes within the grid. When previewing the report, users can select Summarize Notes from the Action menu. A pop-up Summarize Notes dialog will appear, allowing the user to choose Include Context and copy the summary to the clipboard.

Sample Report 15b (Gen AI Notes SummarizeGridNotes)
This report illustrates how to use the SummarizeGridNotes text function to summarize the Notes that appear in the Note segment in a grid (inline grid Note entry).
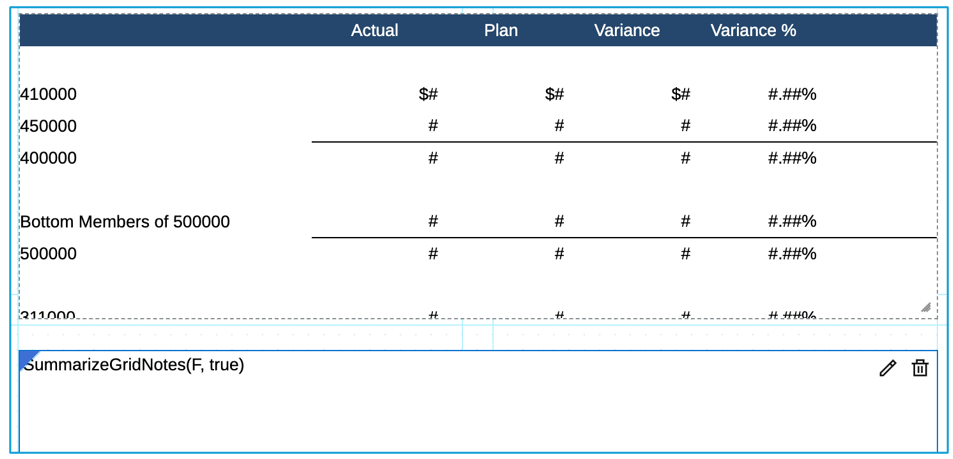
Report Preview view:
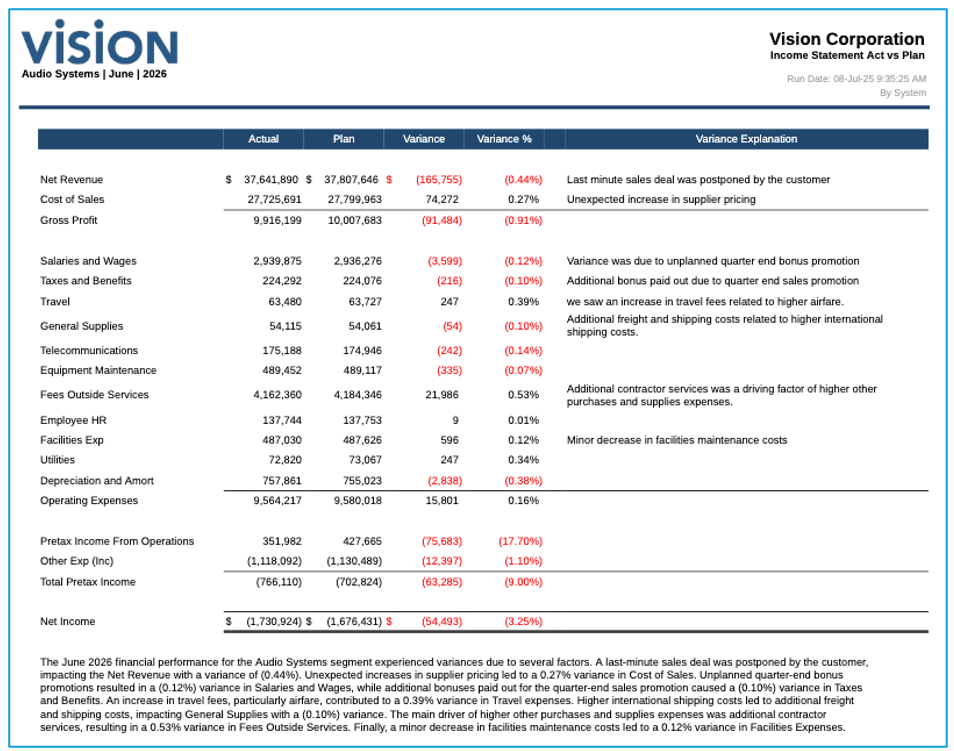
Sample Report 15c (Gen AI Notes Text Box)
This report illustrates the use of a Note text box with an additional optional parameter to Summarize Notes.
Report Design view:
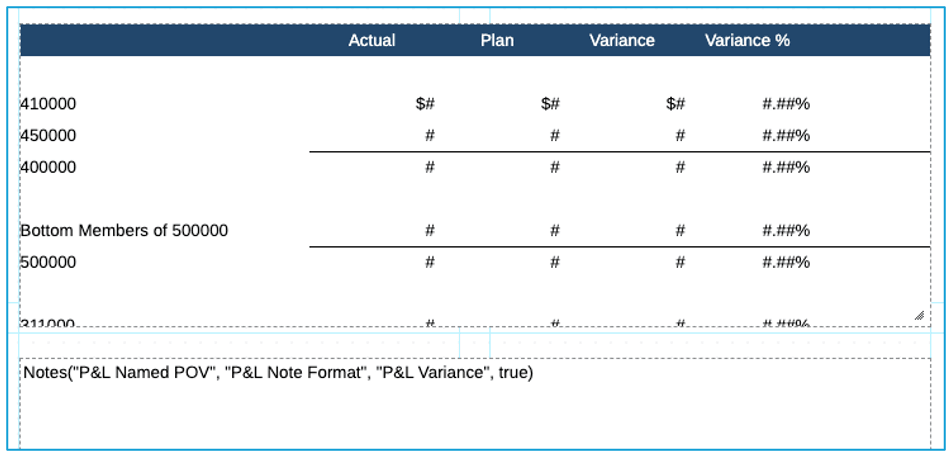
Report Preview view:
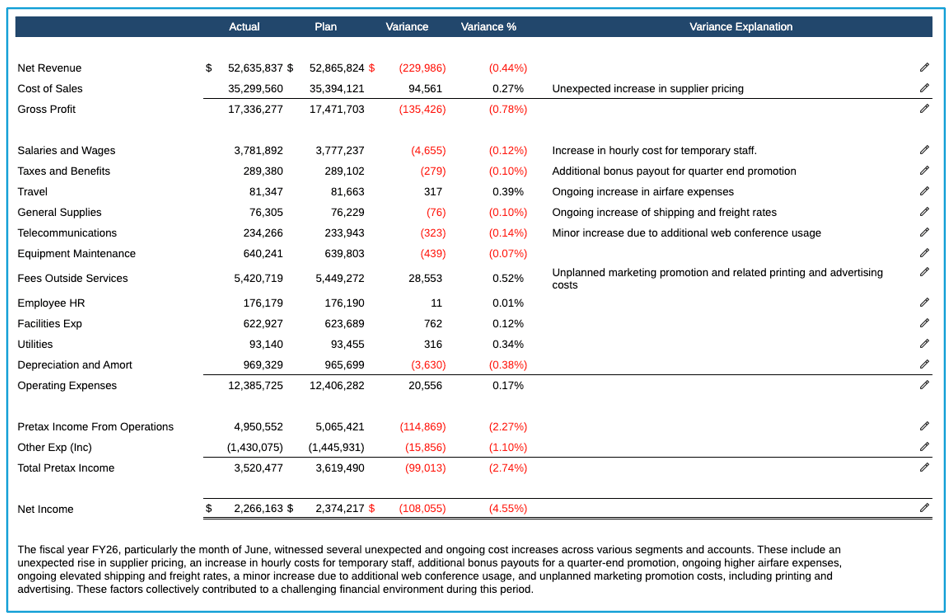
Sample Report 15d (Gen AI Notes GridNotes)
This report illustrates using the GridNotes text function to display and summarize Notes. Two text columns are shown, one displays the original Notes, and the other summarizes the Notes using Gen AI.
Report Design view:
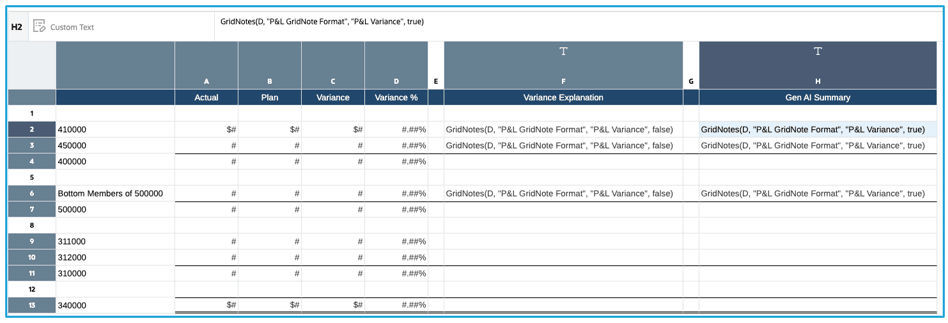
Report Preview view:
