Access the Report Designer, Add a Grid, and Select a Data Source
Begin by accessing the Report Designer and adding a grid.
-
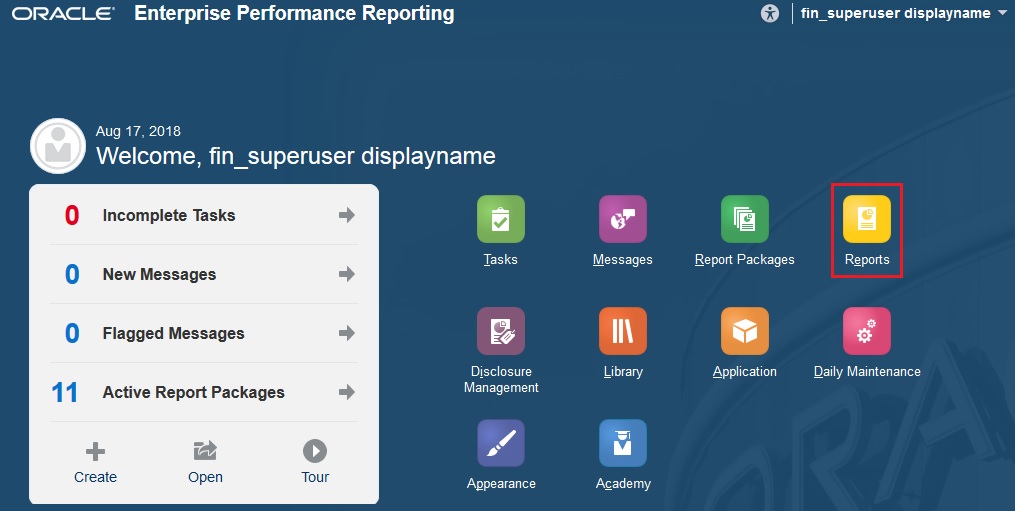
From the Enterprise Performance Reporting Home page, click Reports.

-
Click Create Report
 .
.
-
Click Setup Grid
 .
.
-
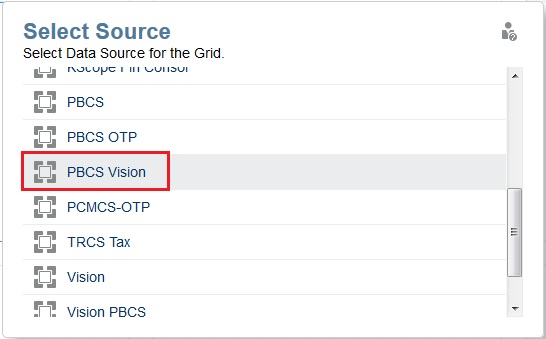
When you add a grid, you are prompted to select a data source. For this report, we will select the PBCS Vision data source.

If you do not currently have a data source set up, see Creating and Editing Data Source Connections for information on setting up a data source.
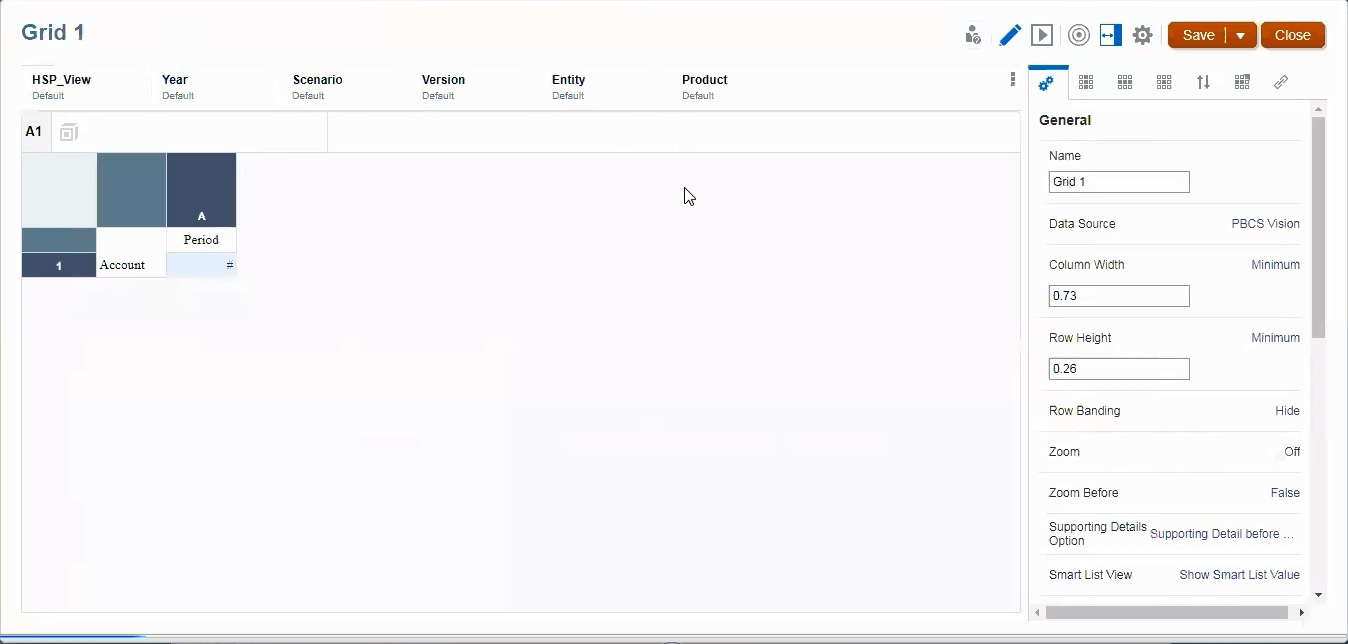
The grid is inserted with the Period dimension as a column and the Account dimension as a row. Note that the POV dimensions are displayed along the top, and the grid properties are displayed on the right.

Review these topics for more information: