Add Report Formatting
You can add formatting to make your report more interesting. In our sample report, we are going to bold some of the headings, add a separator to add some space between the rows, add a formula to sum all the results in the report, add a custom heading, merge the cells that contain duplicate data, and add some borders and shading.
Note:
The following steps show you how to add formatting to the sample report in this Learning Path. Review Formatting Grid Cells for more information on formatting cells.
-
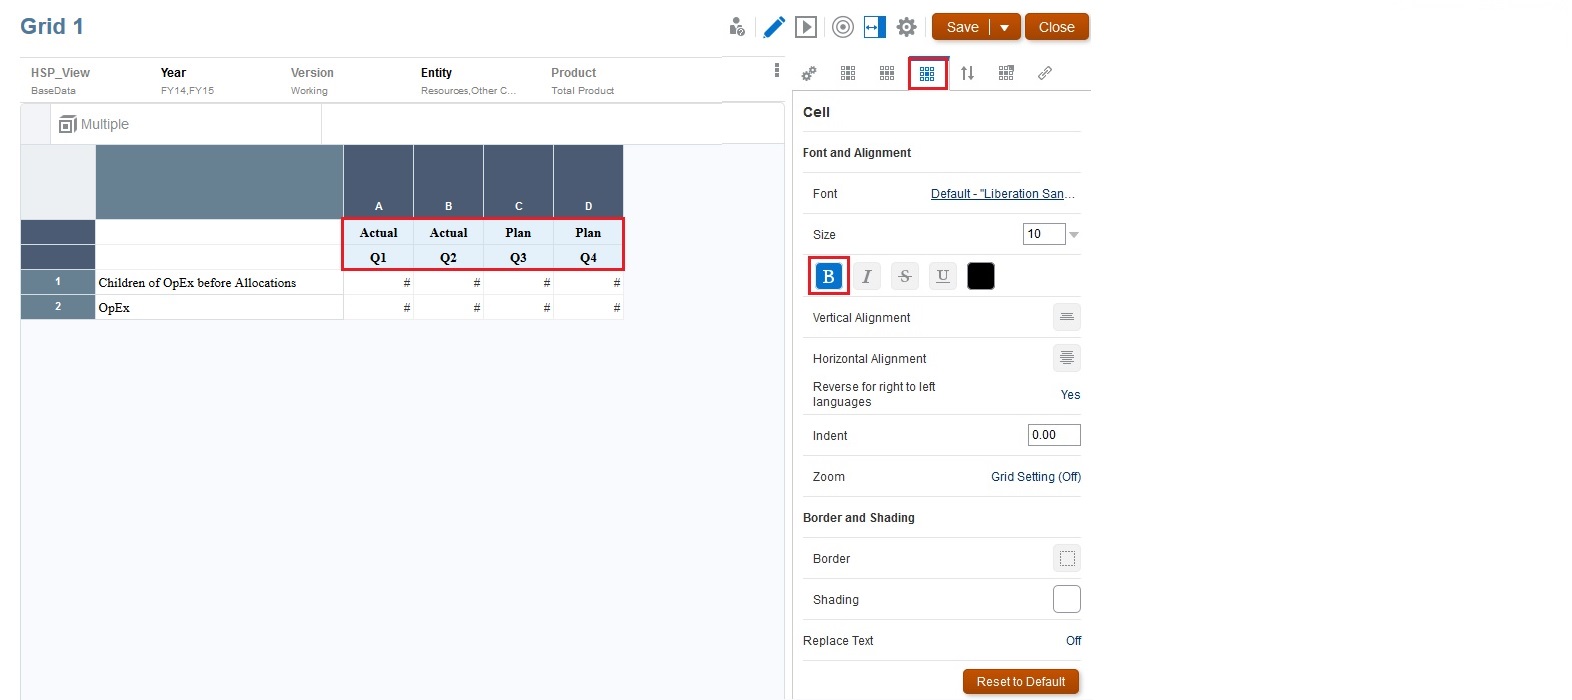
Let's begin by adding bold formatting to the heading cells. To do this, select the Actual, Plan, Q1, Q2, Q3, and Q4 cells, click Cell
 , and then click Bold
  .
.
-
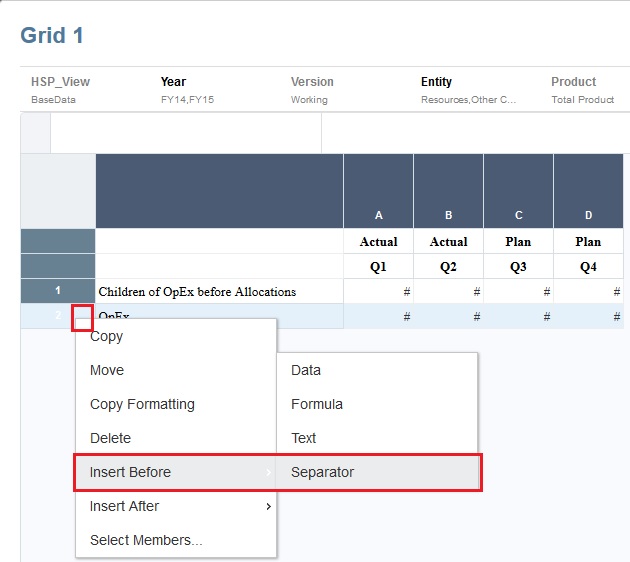
Insert a separator to add a blank row above the OpEx row. To do this, select the OpEx row, click the drop-down arrow by the row number, and select Insert Before, and then Separator.
-
Bold the OpEx row. To do this, click the header cell for the row (the cell with number 3) to select the entire row, then click Cell
 , and then click Bold
  .
.

-
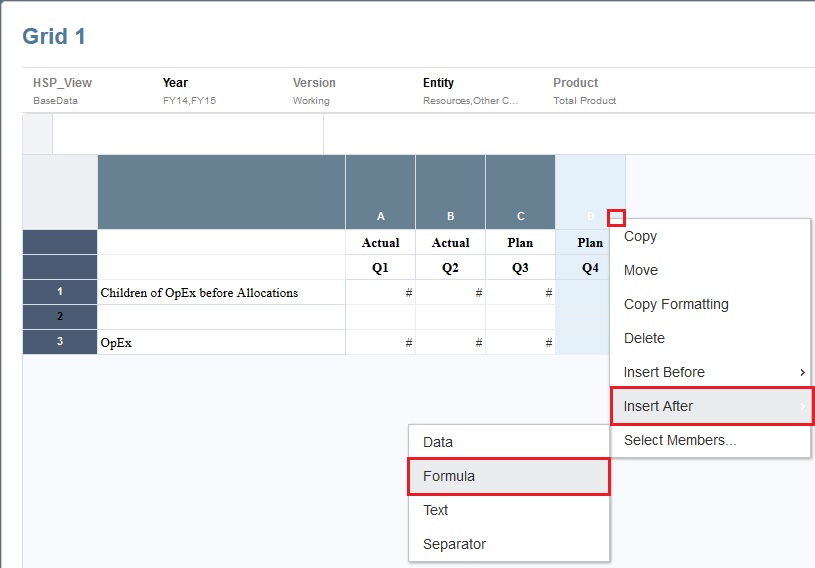
Add a formula to sum all the results in the report. To do this, click the drop-down arrow for column D, and select Insert After, and then Formula.
-
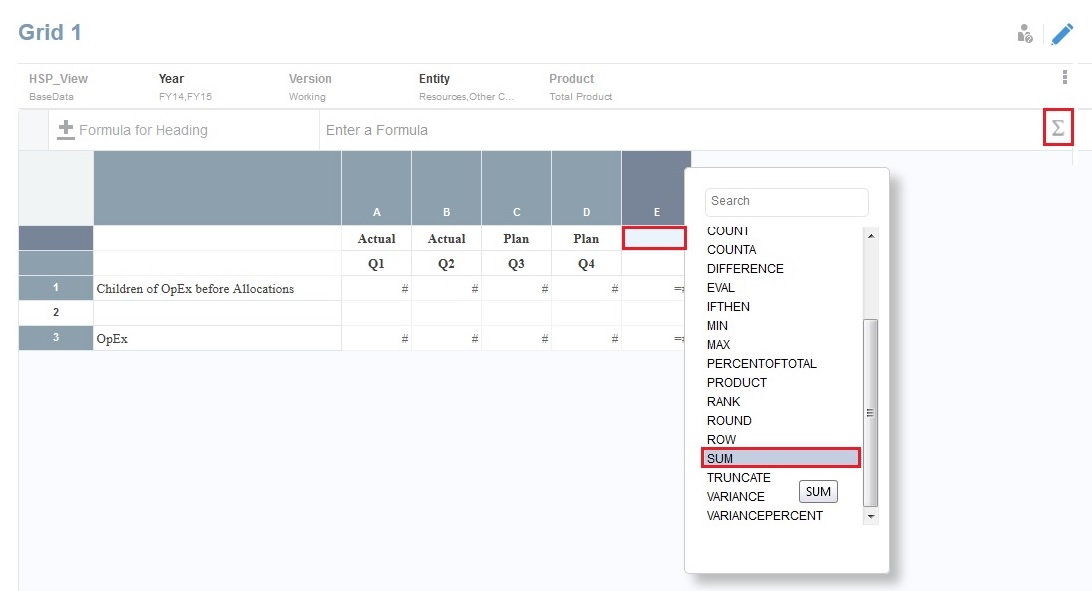
In the newly-created column E, click in the top heading cell; then, in the formula bar, click Formula Functions
 , and select SUM().
- Enter the sum as SUM([a:d]), and then click Accept
 .
.
![Sum formula entered as SUM([a:d]) Sum formula entered as SUM([a:d])](img/sum_formula.jpg)
The formula is now displayed in the grid.
![Grid showing the SUM([a:d]) formula Grid showing the SUM([a:d]) formula](img/grid_with_sum_formula.jpg)
-
Click Formula for Heading
 , and select Custom Heading to make the cell heading blank.
-
Place your cursor in column E on the Q1, Q2, Q3, Q4 row, and next to the
 button type in the custom heading "Total Year", and click Accept
  .
.
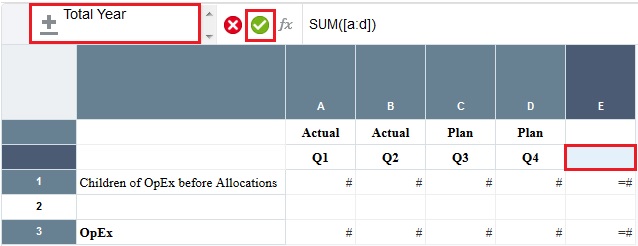
Total Year is now displayed as a heading in the grid.
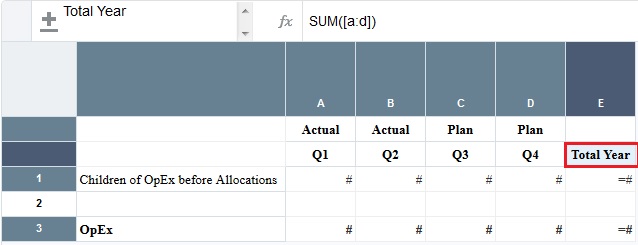
-
Merge the repeating "Actual" and "Plan" Scenario labels.
To do this, select the two Actual cells, then right-click the cells, and select Merge Cells.
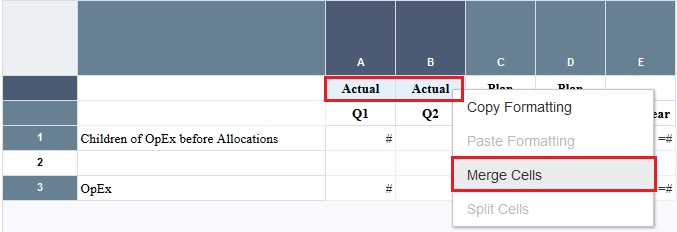
Do the same for the two Plan cells.

-
On row 3, select the # cells.

-
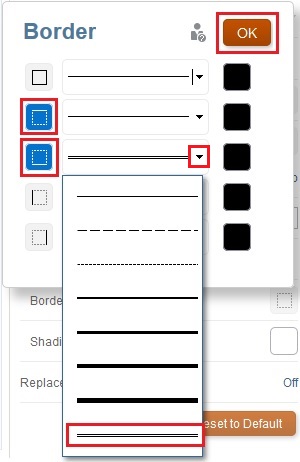
In the Cell properties on the right, under Border and Shading, click Border
 , and select the Top
  and Bottom
  options. In the Bottom option, select a double underline, and then click OK.
-
Click Preview
 to preview the grid. You can see that it looks better with the formatting we have done.

-
Click Save to save the report, enter a name for the report, and then click Close to return to the Report Designer.