About Trace
The Trace is a diagramatic representation of data forms. It enables:
- Visualizing relationship of data in forms using sankey diagrams.
- Tracing allocation amounts flowing through a model. For example, where money is spent, how you spent it, and how much is consumed by each segments involved in production.
- Re-alligning expenses from where they were spent, through which department, function, and which utilities have consumed those functions.
- Evaluation and validation of the flow of expenses against profits.
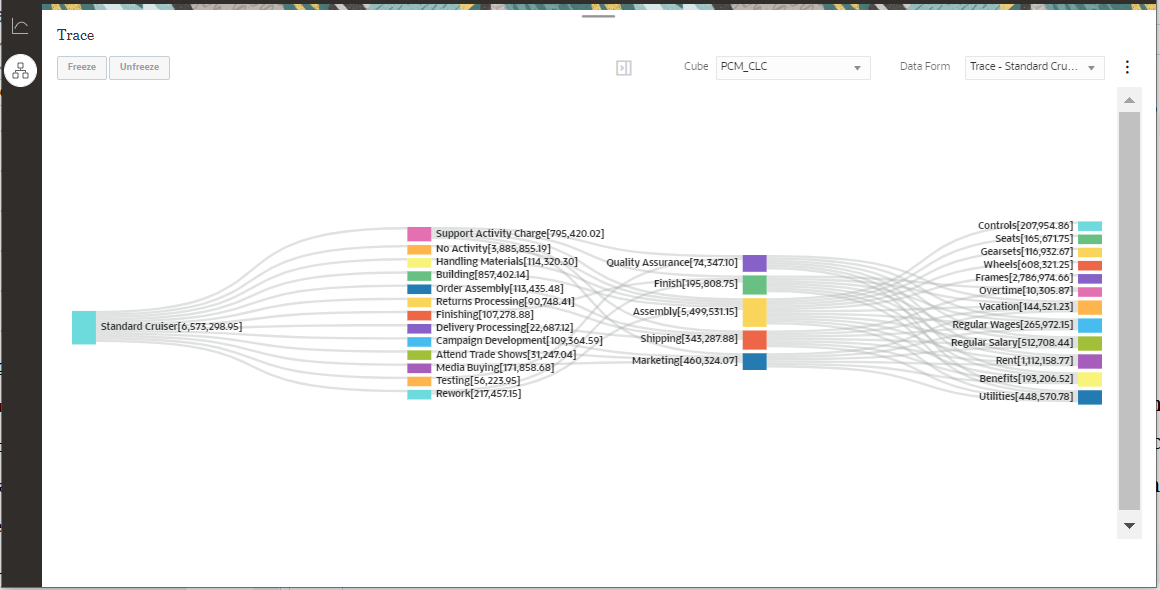
The following diagram shows the product costs for the "Bikes" company in the BKsML50 sample application provided with Enterprise Profitability and Cost Management. (See Creating the Sample Application.) The right-most nodes of the diagram show the costs involved in the manufacturing of all products. These costs are associated with the products through the various departments, and the departments use these things in some of the functions they perform. The diagram shows how costs are aligned to the product.
