Designing Data Forms for Trace
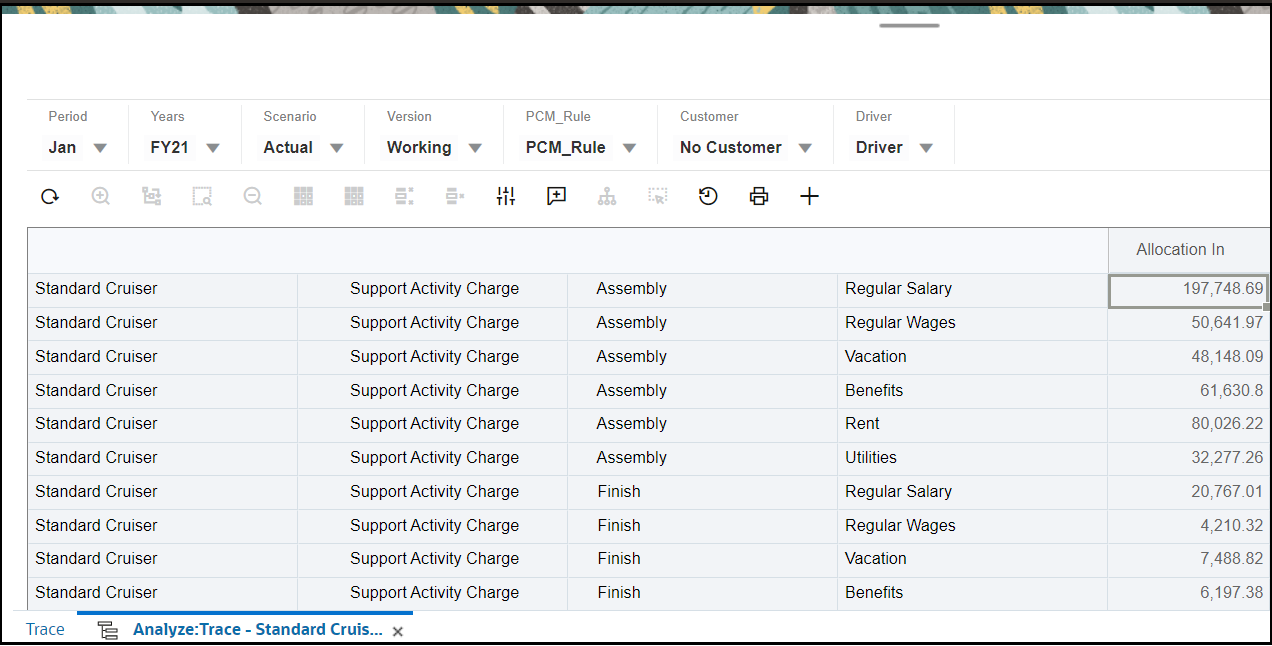
A Trace data form contains the dimension values that you want to trace using the sankey diagram. In a Trace data form, the first dimension in the row is your starting point in the trace diagram, and the subsequent dimensions are additional ones you can trace the amounts through. Here, the money flows from the rightmost dimension to the leftmost dimension.

Allocation In (the column dimension in the last cell) is where you track the movement of money. The money flows from the rightmost dimension to the leftmost dimension. You can narrow down the data tracing by making selections in the point of view dimensions (for example, in the figure above, No customer is selected for the Customer point of view dimension). This enables tracking the flow of money before it's pushed out to the customers.
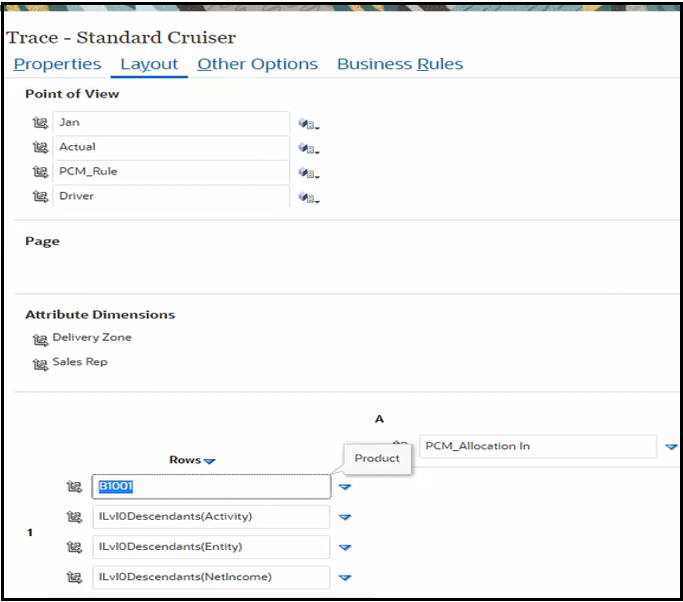
In the data form designer below, PCM_Allocation In is the default member. PCM_Allocation In is a member in the PCM_Balance dimension in which you track amounts posted by the allocation rule. Allocation In is an inward flow of amounts. Here, you can track the PCM_Allocation In member and decide across which dimensions you want to track. In a Trace data form, those dimensions are displayed in rows.

In this example, for the first row dimension, a specific product B1001 (Standard Cruiser) is selected. This is your starting point in the Trace diagram. As a best practice, select a specific value for the first row dimension, so that the Trace diagram generated will not be huge and complex.
For functions (in the Activity dimension) that are performed for the product, ILvl0Descendants (Activity) is selected. ILvl0Descendants (Entity) is selected for departments or cost centers in the Entity dimension which perform those functions. ILvl0Descendants (NetIncome) is selected for actual funds traced.
As a best practice, you can design a data form in such a way that it limits the number of points (nodes) in the diagram. This enables generating a simplified trace diagram. You can do this by selecting a narrow range of dimensions. For example, select level 0 decendents of all activities (row dimension displayed in the second column of the data form), or select dimensions with limited members, or select dimensions where you can limit the number of level 0 rows you see. It allows scaling the results of the data form, enabling a more realistic visualization. For more information on selecting members, see Using the Member Selector.
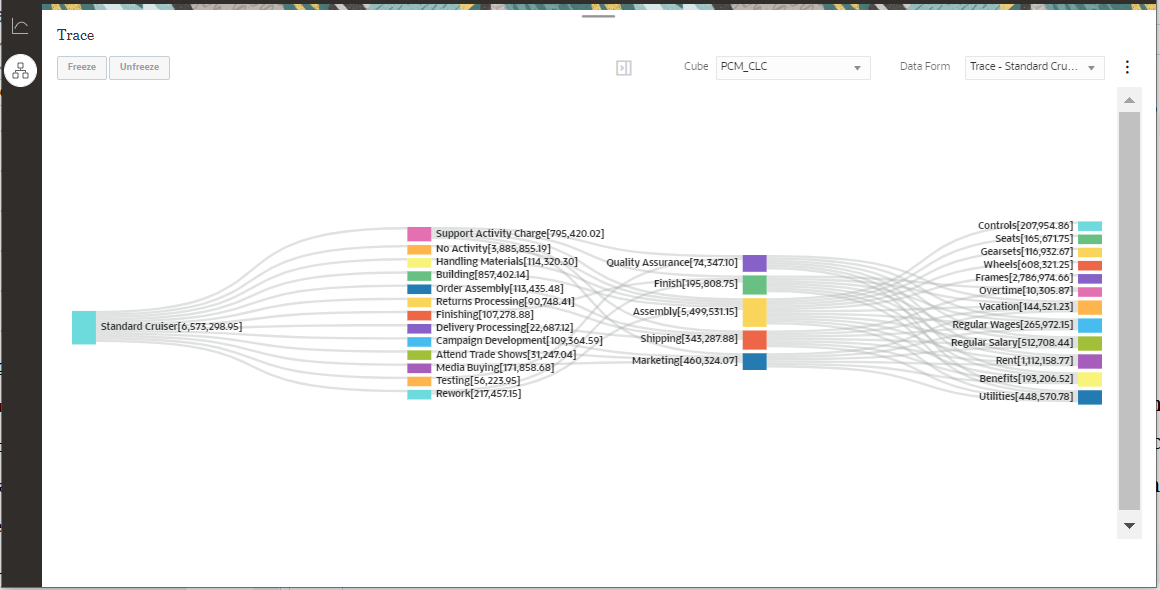
The following diagram is generated from the data form designed above:
