Analyzing Data for a Single Calculation Record
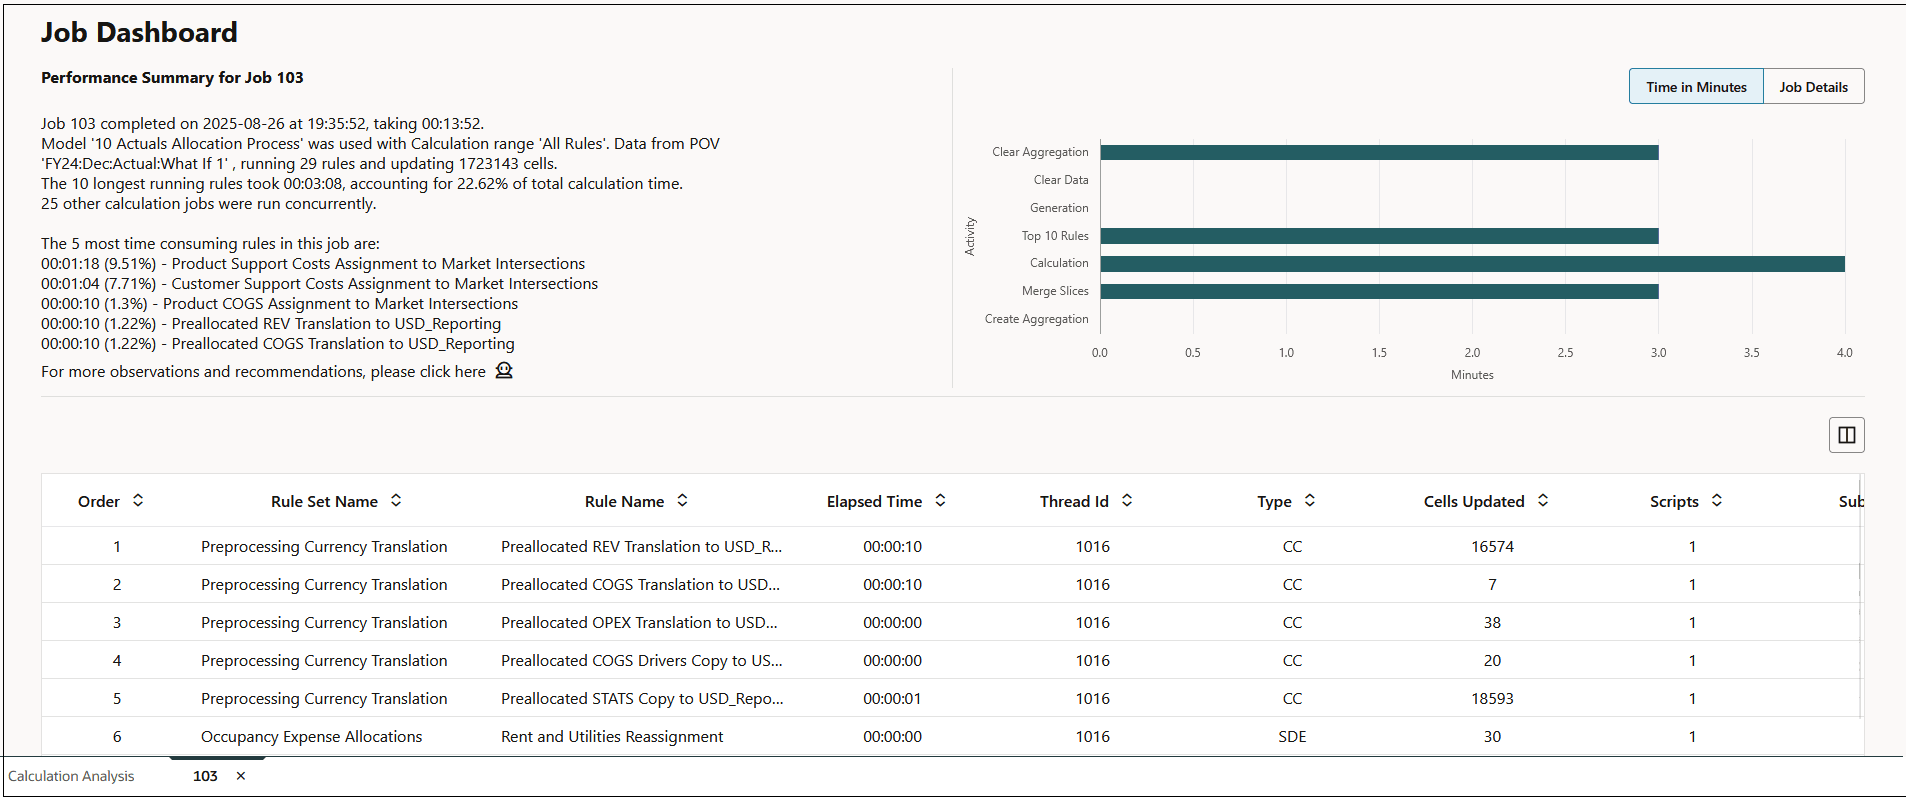
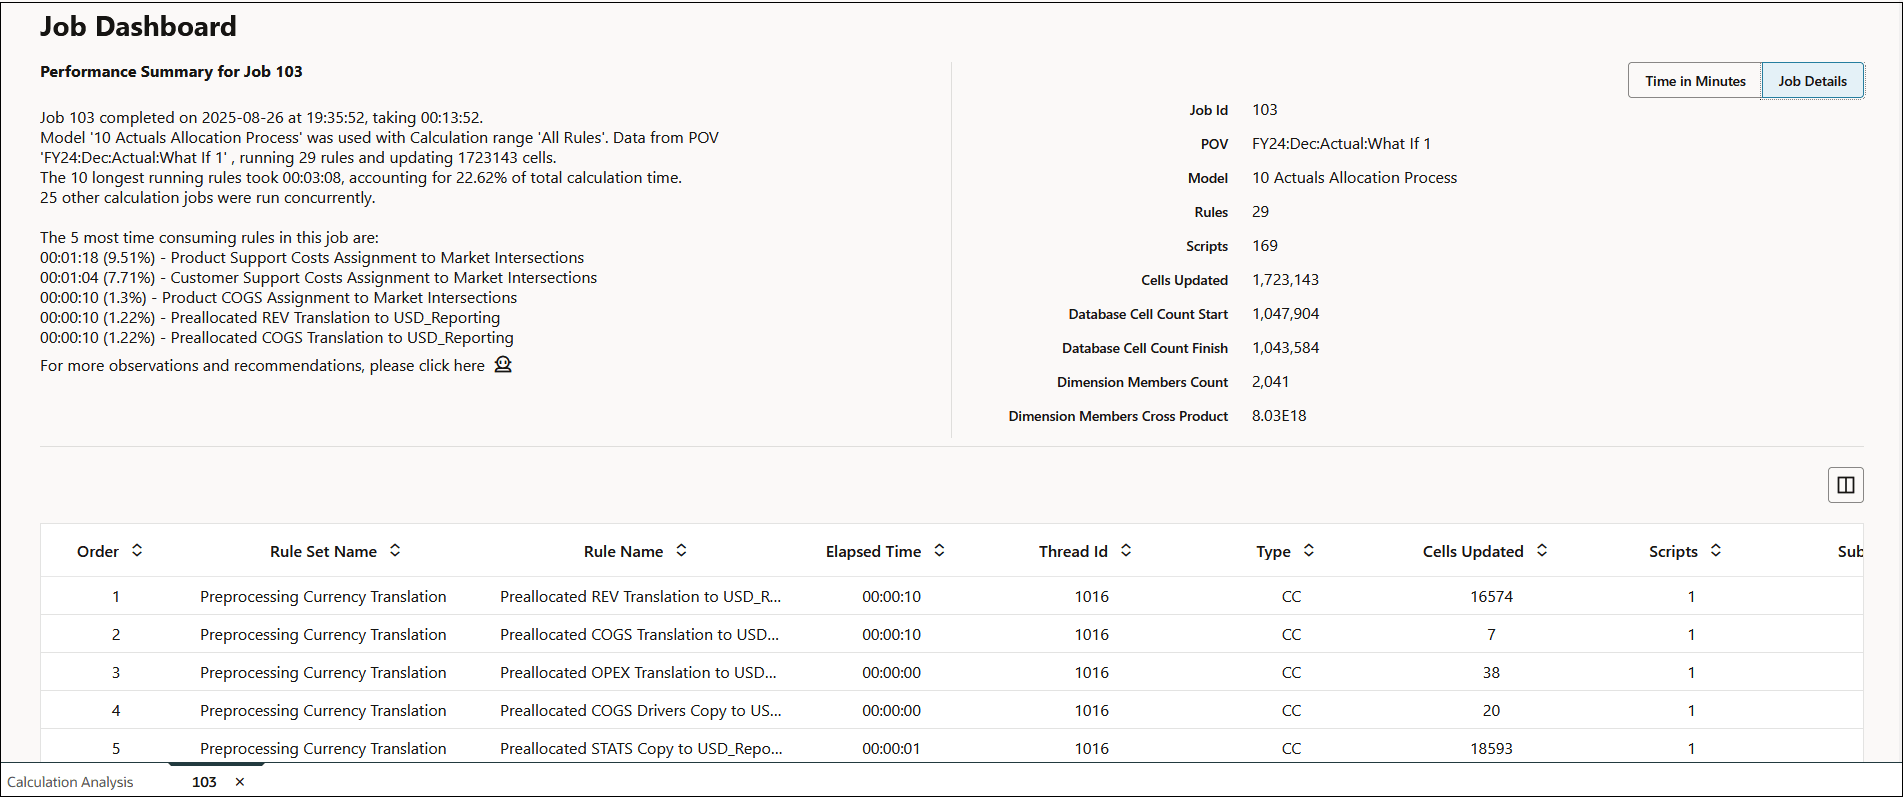
The Job Dashboard displays the performance diagnostics for a single calculation record. The Performance Summary is listed on the left, and you can select whether to display the Time in Minutes it took to run the job or the Job Details next to the performance summary. Detailed information about each rule set and rule in the calculation record is displayed at the bottom of the page.
To access the Job Dashboard:
-
From the Home page, select Modeling, and then Calculation Analysis.
-
From the Calculation Analysis page, select a single calculation record.
-
Click Analyze Performance.
-
Click Time in Minutes or Job Details to select which information to view.
Sample Job Dashboard Report with Time in Minutes Selected

Sample Job Dashboard Report with Job Details Selected

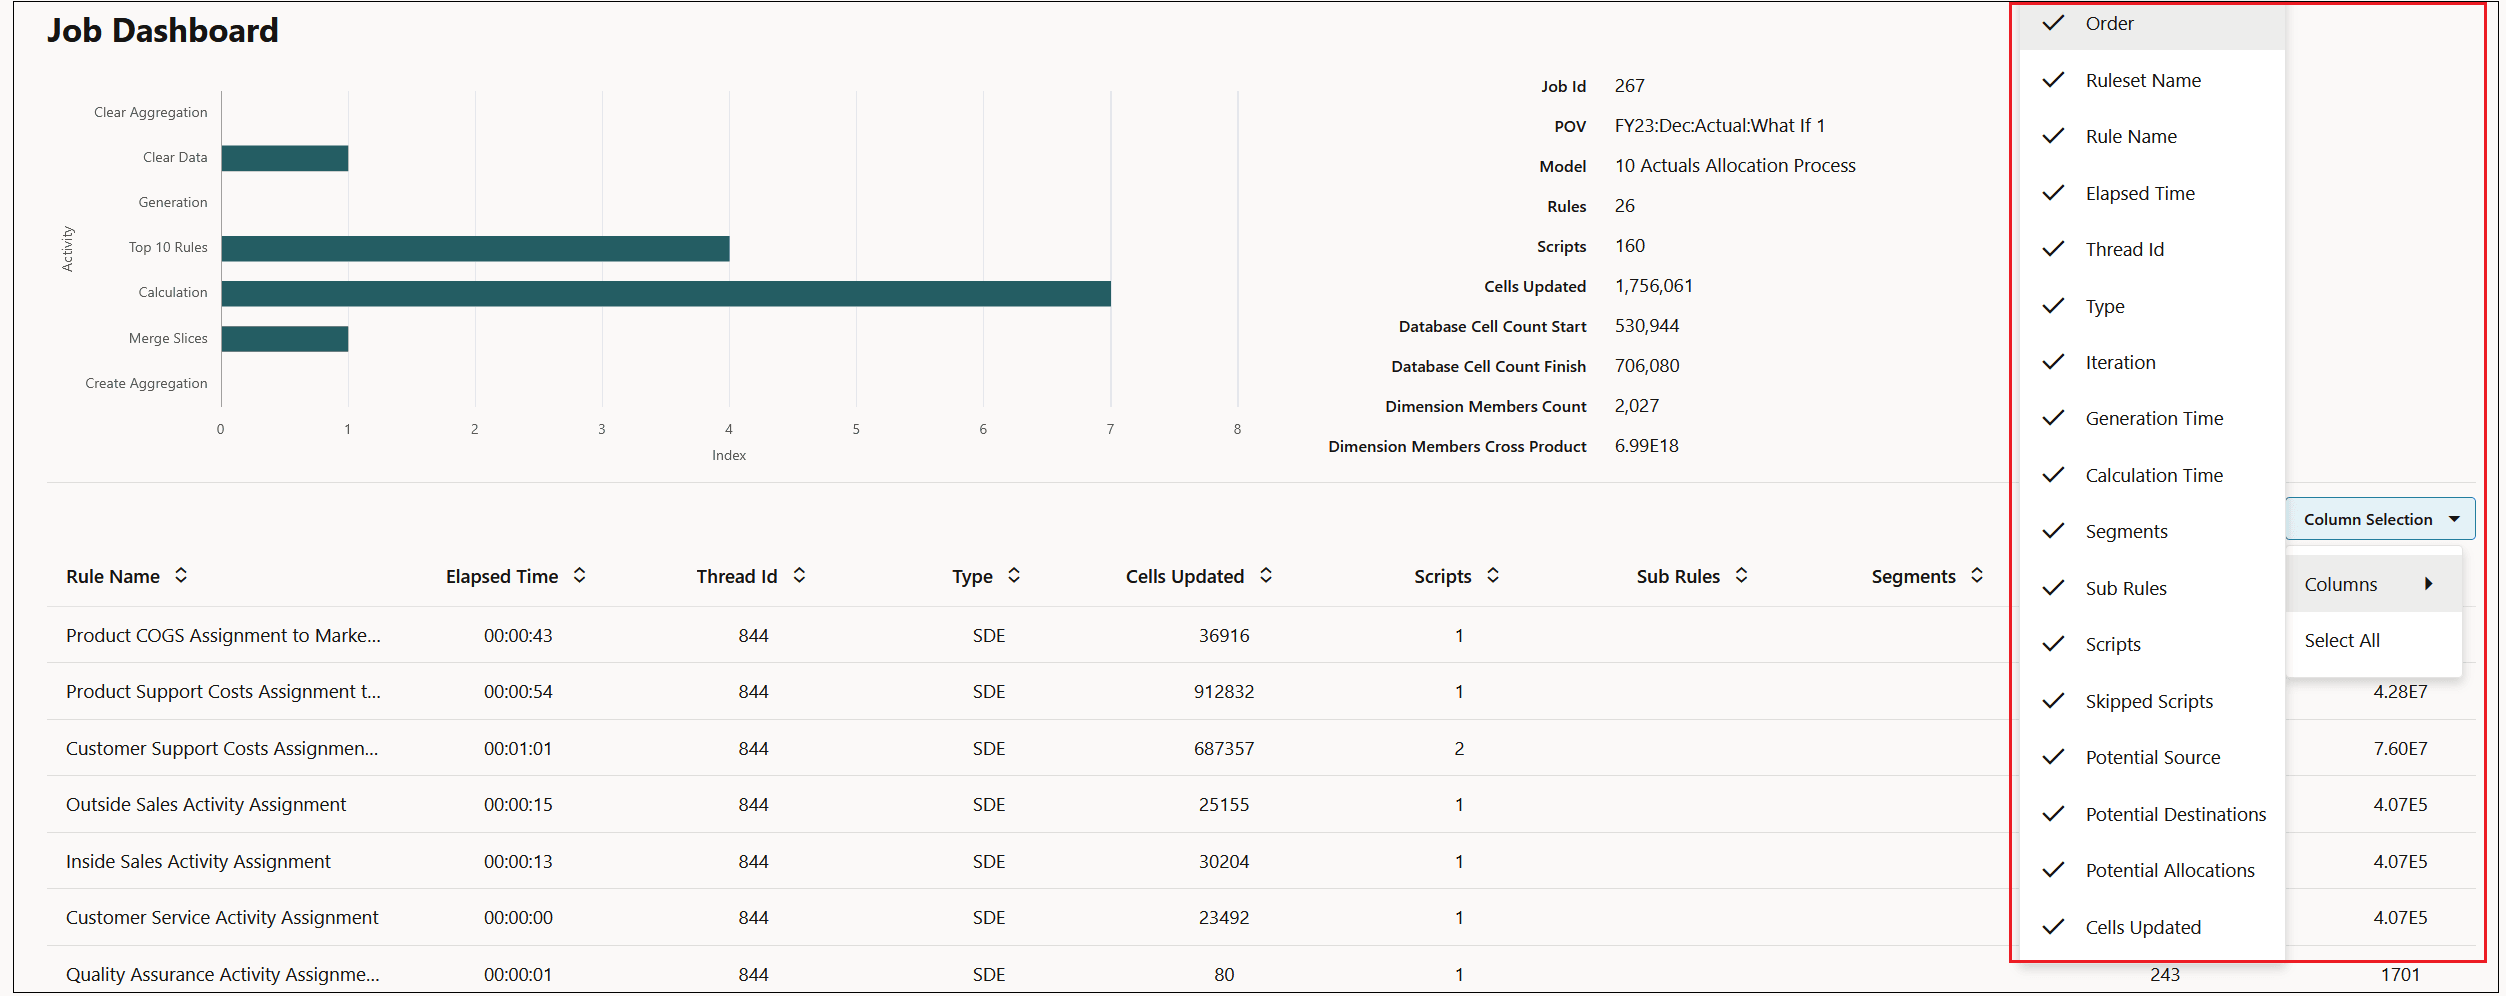
To change the columns displayed on the Job Dashboard report, click the drop-down next to
Columns (![]() ) and select or de-select the desired columns.
) and select or de-select the desired columns.

Tip:
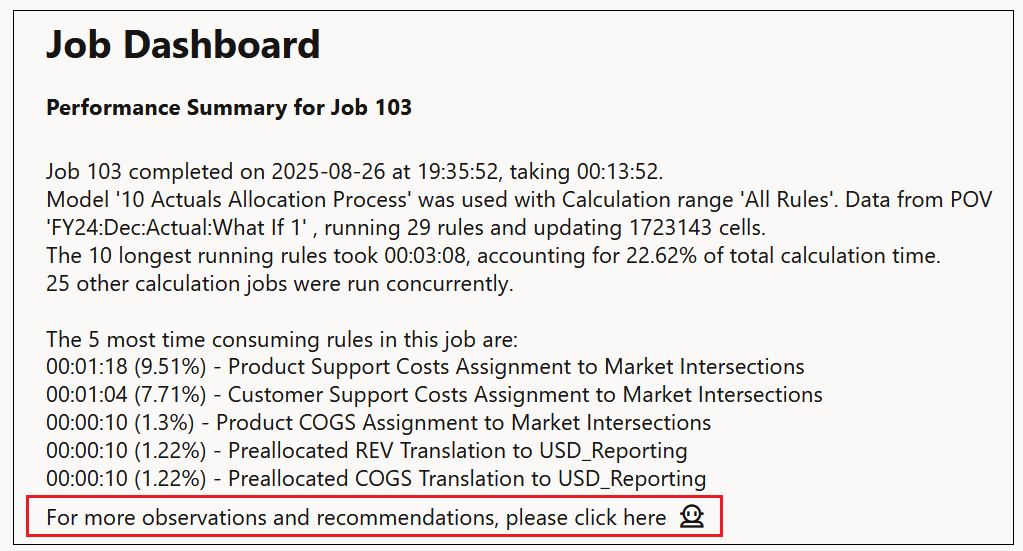
Click ![]() to access the PCM Agent Health Check Advisor for suggestions and
recommendations that provide you with valuable information to help you to identify
performance bottlenecks (see Using the PCM Agent Performance Assistant to Help Idendity and Resolve Calculation Performane Issues).
to access the PCM Agent Health Check Advisor for suggestions and
recommendations that provide you with valuable information to help you to identify
performance bottlenecks (see Using the PCM Agent Performance Assistant to Help Idendity and Resolve Calculation Performane Issues).
