View the Activities by Status Report
The Activities by Status report shows the status of each activity within the reporting period. This report displays the number of activities assigned to the selected resource (or resources grouped by their type and final status within selected dates. This report does not include deleted activities.
buckets/organizations
individual resources
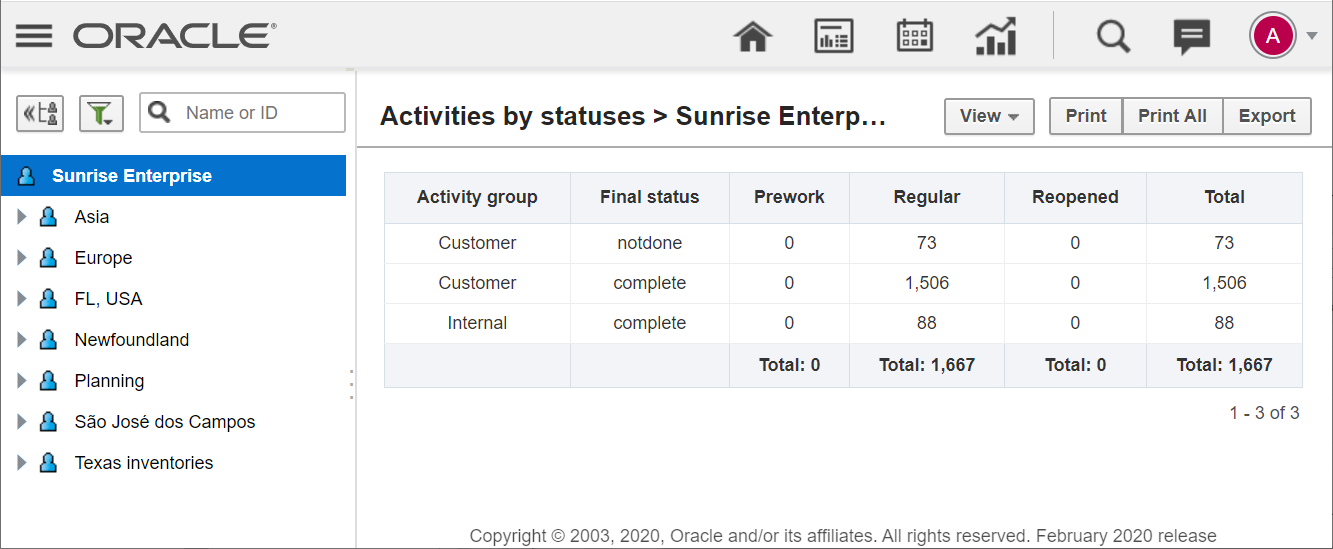
You can either view the report details as a pie chart or in a table.
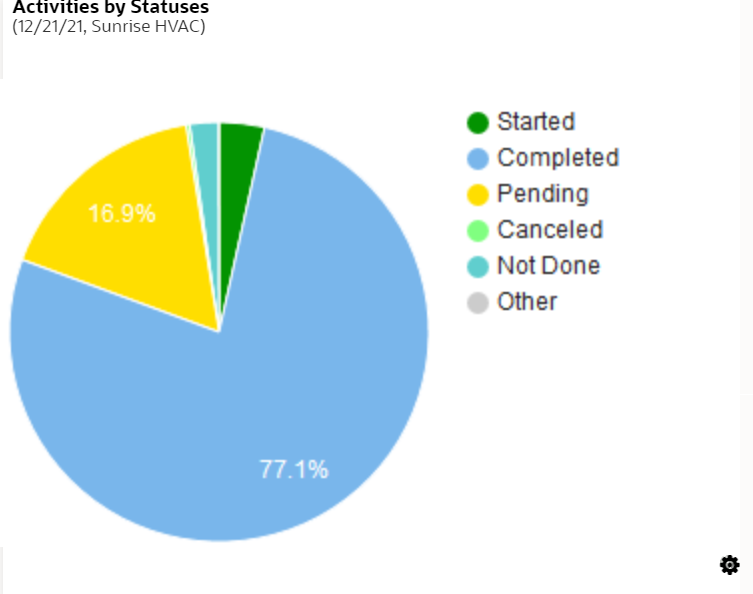
To open the dashboard report, click Dispatch and then select Dashboardfrom the drop-down menu. The Activities by statuses dashboard report is represented with a pie chart.
The Activities by statuses dashboard report shows data for the day selected in the calendar. The chart options allow choosing the selected date or the date before it. You can filter to display data for a particular activity type group or for any activity types represented in the list of activities assigned to the selected resource.
This figure shows the Activities by statuses report as a pie chart. The list of statuses are displayed in the Legend.
To view the Activities By Status report:
Results:
This figure shows the Activities by Status report showing the activity group, final status and the total count of prework, regular, and reopened activities.
This table displays the Activities by statuses elements and their description.
| Element | Description |
|---|---|
| Header | Displays the report name and date in parentheses. |
| Slices | The entire diagram represents all activities assigned to the selected resource on the specified day and is assumed to be 100%. Each colored slice represents the activities of a certain status showing the percentage share of such activities in the whole number. Apart from differentiating the activity statuses in colors, you can also view them as text in the chart hints. |
| Legend | Statuses of the activities assigned to:
|
| Hint | Activity status, the number of such activities assigned to the resource and their percentage share in the whole number of activities. |