View the Mobile App Usage by Versions Report
You can identify users who use older versions of the mobile application through the new standard reports that you can add to a dashboard. With these standard reports, you have better visibility about the devices and versions of the Oracle Fusion Field Service mobile applications used by your mobile workers.
A new report, Mobile App Usage by Versions is available on the Dashboards page. The chart shows the percentage of users using each version of the Android or iOS apps based on logins for the last seven days.
To view the Mobile App Usage by Versions report:
-
Select the Mobile App Usage by Versions chart from Available
Reports.
Note: Administrators can control the availability of this chart for a user type by enabling the chart from the user type's available reports list.
This image shows the Mobile App Usage by Versions chart;:
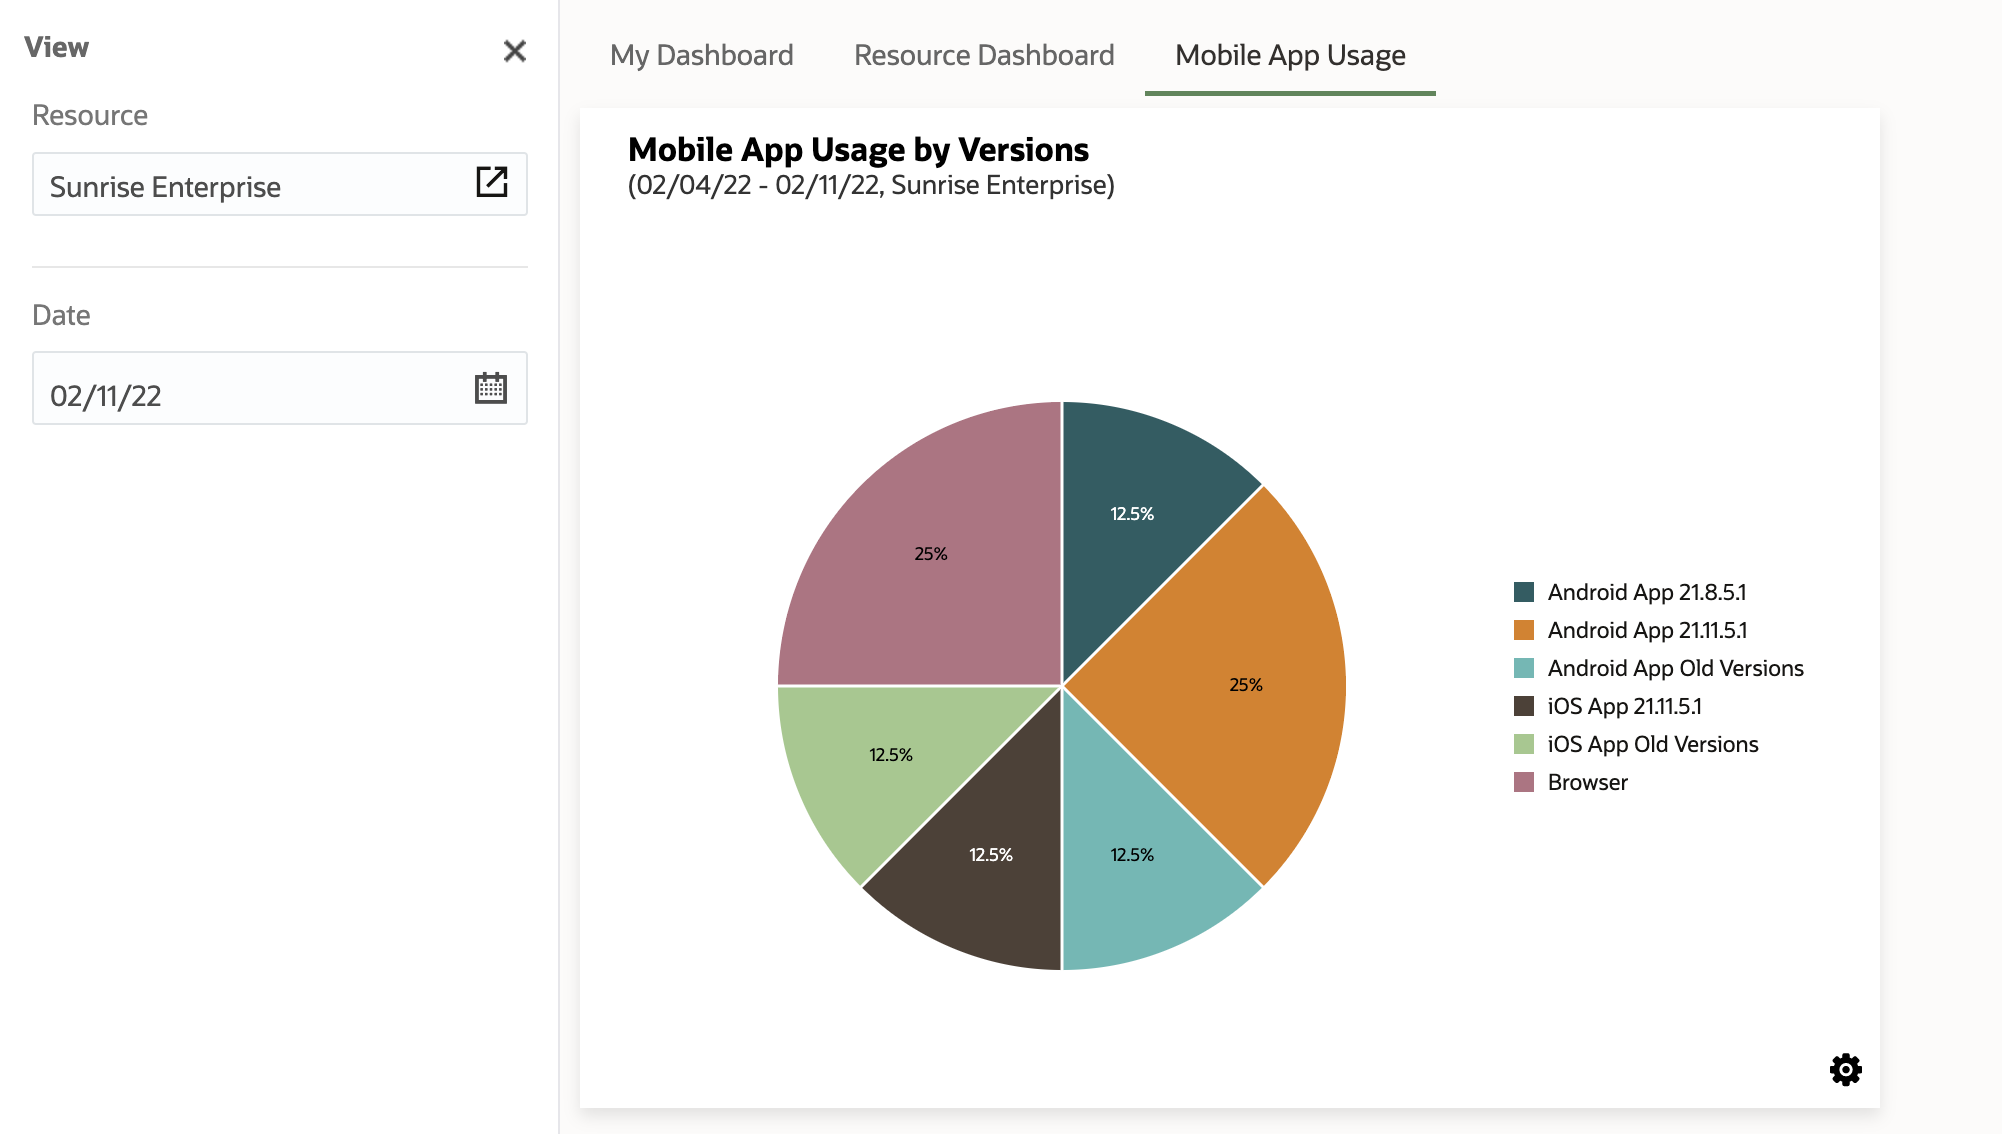
The chart shows the percentage of users that logged into Oracle Fusion Field Service through browsers within the last seven days. The application treats the same user that logged in through different applications as different users and track them separately within the chart.
-
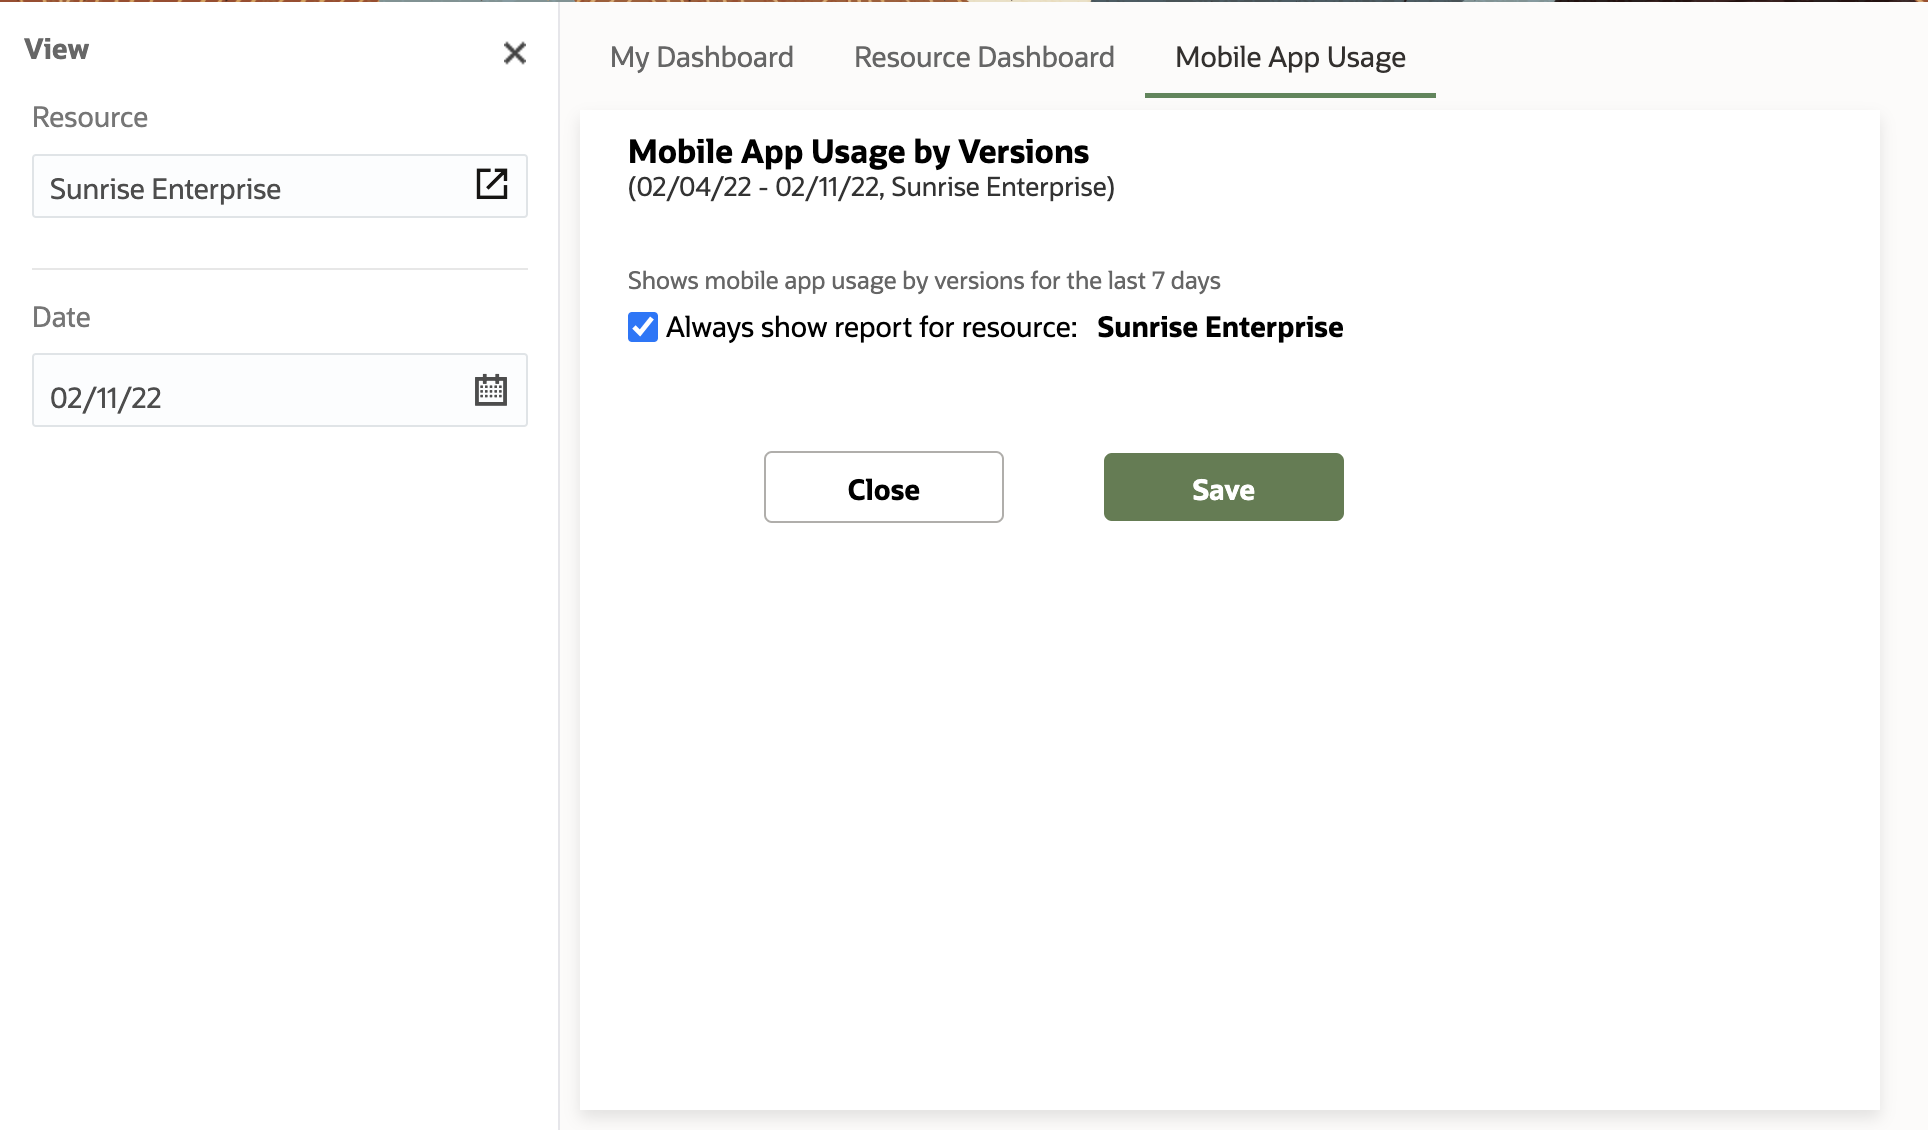
You can filter the chart using the resource or date filters available on the View filters
section. If you want to keep the chart fixed for a specific resource type, you can configure
that from the Settings page of the chart.
This image shows the Mobile App Usage by Versions chart options: