- Configuring and Using Reports
- Navigate the Dashboard
Navigate the Dashboard
Use the navigation icons in the screen to navigate the Dashboard.
- Click the navigation button and click Dashboards.
- Open a report.
-
Click the Preferences icon.
You can see the options to set the report to open with the selected resource, organization, or bucket.
-
Optionally, set values for these fields.
- Click Always show report for resource check box to ensure that the most current chart data displays whenever you open the Dashboard.
-
Select a date from the drop-down list.
By default, the chart displays statistics for the current day. This screenshot shows the Always show report for resource setting:
- Click Save.
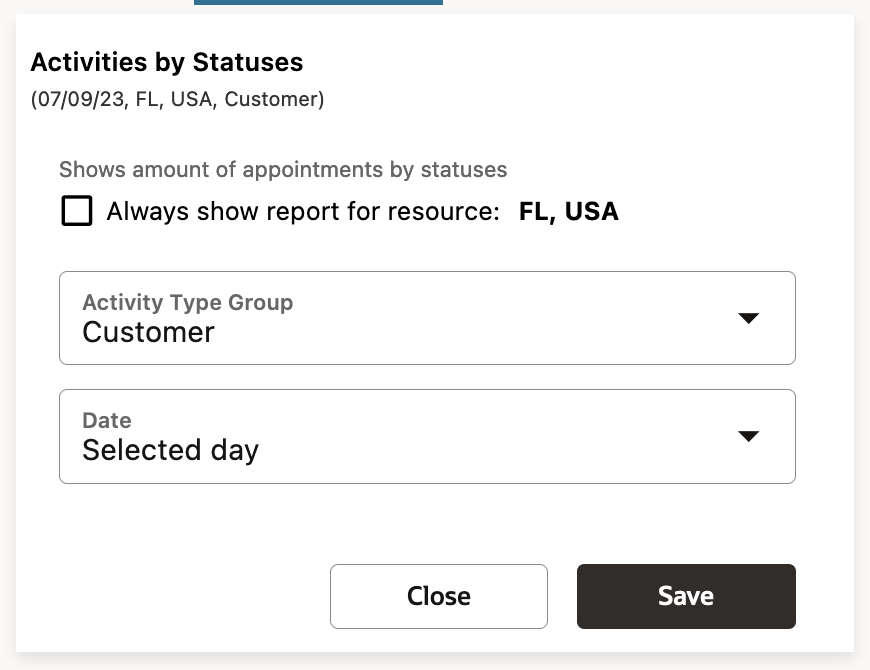
This chart always displays in your Dashboard for the selected resource, bucket, or organization, regardless of the entity you selected in the resource tree. - Click the Minimize icon to hide
the chart from view.
See Modify Dashboard Reports for details about minimizing charts.
- Click the Close icon to close the Dashboard.