Viewing the Hierarchy Analysis
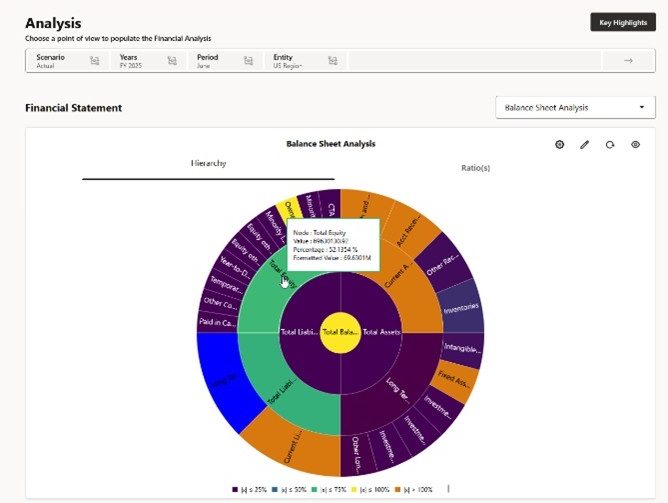
When you generate Financial Analysis results, the Hierarchy analysis is automatically configured as part of the dashboard on the Analysis page. It provides a graphical view of a parent member of a Balance Sheet along with its children.
You can select up to four nodes of a parent member in a single analysis that you want to review. Each of the nodes displays the actual data and the percentage change with respect to its parent,. It also displays any significant deviations, for example, if retained earnings are low compared to prior periods. The node analysis can be viewed with prior periods, quarters, half-year or yearly comparisons for single or multiple periods.
For example, if you selected a Balance Sheet, the Balance Sheet hierarchy will display four levels of data at a time, and the ratios that were created for it in the Ratios section. You can select any of the four levels and Zoom In to the next four levels of data. When you hover over a slice of data in the chart, you can view the Node, Value, Percentage, and Formatted Value. The Node is the member name, for example, "Total Equity". The Value is the actual computed data, Formatted Value is the value converted into thousands or millions, depending on the amount of data. Percentage is the amount you specified during configuration.
You can click View Node Analysis to display a Bar chart, for example, Periodic Comparison of Total Equity. The Periodic comparison is based on the time series that you selected during configuration.
On the Analysis tab, when you hover over each bar in the Bar chart, it displays more details. The Explainability tab displays an explanation, for example, "This analysis highlights that the data value is within range."
-
On the Home page, click Financial Analysis Hub, then select Analysis.
-
For the POV, select the POV members that you specified for the configuration.
-
From the drop-down list of configurations, select the Configuration for the analysis you want to view.
-
From the Analysis page, click Hierarchy.
-
Hover over an area to view the details.
-
Double-click an area to drill down to see detail, or right-click and select Zoom In to drill down to the next four levels of data.
-
Right-click and select View Node Analysis to display a Bar chart, then hover over each bar for additional detail, for example, Analysis and Explainability.
-
To return to the top level, click Refresh.
Figure 23-3 Financial Analysis Hierarchy Example