Viewing Financial Analysis Ratios
When you generate Financial Analysis results, the Key Metrics Analysis is automatically configured as part of the dashboard and is displayed in the Ratios section. This section provides a detailed view of various Balance Sheet ratios across single or multiple periods, highlighting deviations from previous periods and comparing them against industry benchmarks.
Ratios are configured as part of the Configuration page. When you attach ratios to a Financial Statement during the configuration process, the ratios are run when you generate the Financial Statement. The Ratios section provides out-of-the-box ratio calculations and Custom ratios. For example, it includes default Balance Sheet ratios such as Current Ratio and Inventory Turnover Ratio, default Income Statement ratios such as Gross Profit Margin Ratio, Operating Profit Margin Ratio, and default Cash Flow Statement ratios such as Cash Flow Ratio, and Operating Cash Flow Ratio. The ratios are represented through graphs for easier interpretation.
Custom Financial Statements that you create display in the same manner as out-of-the-box Financial Statements based on the expression used in the configuration and the attached ratios.
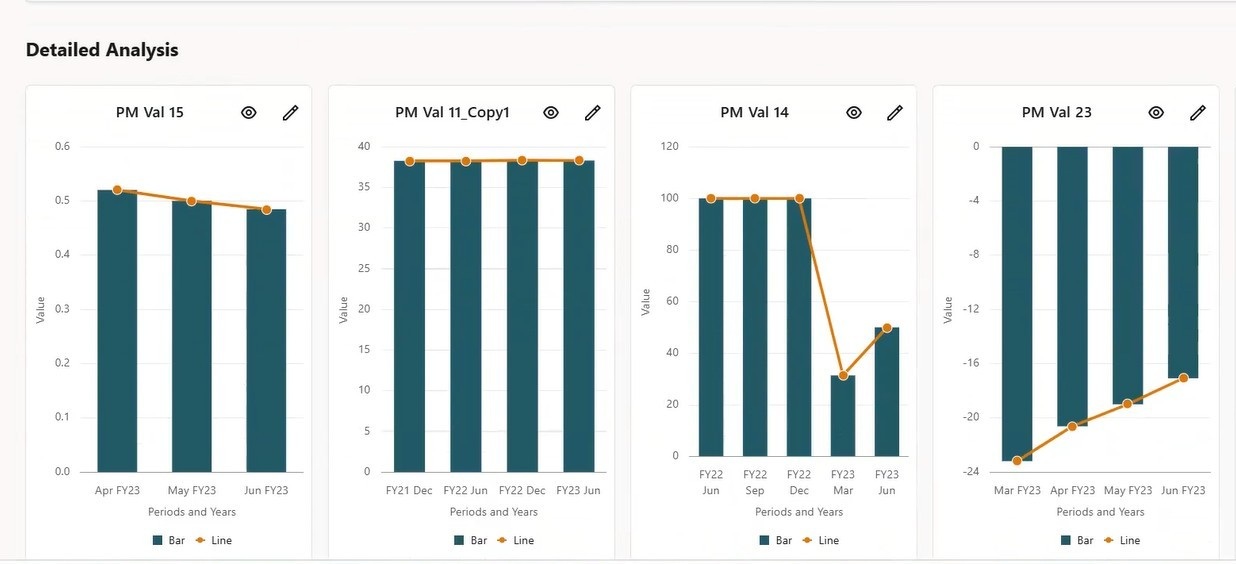
The Detailed Analysis section is available at the bottom of the Analysis page and is independent of any Financial Statement. It displays the custom expression or custom ratio in a combination of Bar and Line graphs. When you click View Details for Detailed Analysis, it provides the prior period comparisons and Exception Algorith Analysis based on the time series and Exception Algorithm, such as Z Score or Modified Z Score, that you specified during configuration.
-
On the Home page, click Financial Analysis Hub, then select Analysis.
-
For the POV, select the POV members that you specified for the configuration.
-
From the list of configurations, select the Configuration for the analysis you want to view.
-
From the Analysis page, click Ratios.
A graph is display for each Ratio. You can hover over the graph to view the Value, Formatted Value and Expression.
-
Click the View Details button
 to open the Details page. You can view
additional details about the ratio, and the
Explainability tab, for example, if the computed
range is out of the ideal range that you selected during configuration.
to open the Details page. You can view
additional details about the ratio, and the
Explainability tab, for example, if the computed
range is out of the ideal range that you selected during configuration.
-
From the Detailed Analysis section, you can hover over a Ratio to view the Custom formula. The Detailed Analysis displays the custom formulas that were created separately and not attached to any Financial Statement.
-
To edit a configuration directly from the Analysis page, click the Edit button.

Figure 23-4 Financial Analysis Ratios Example
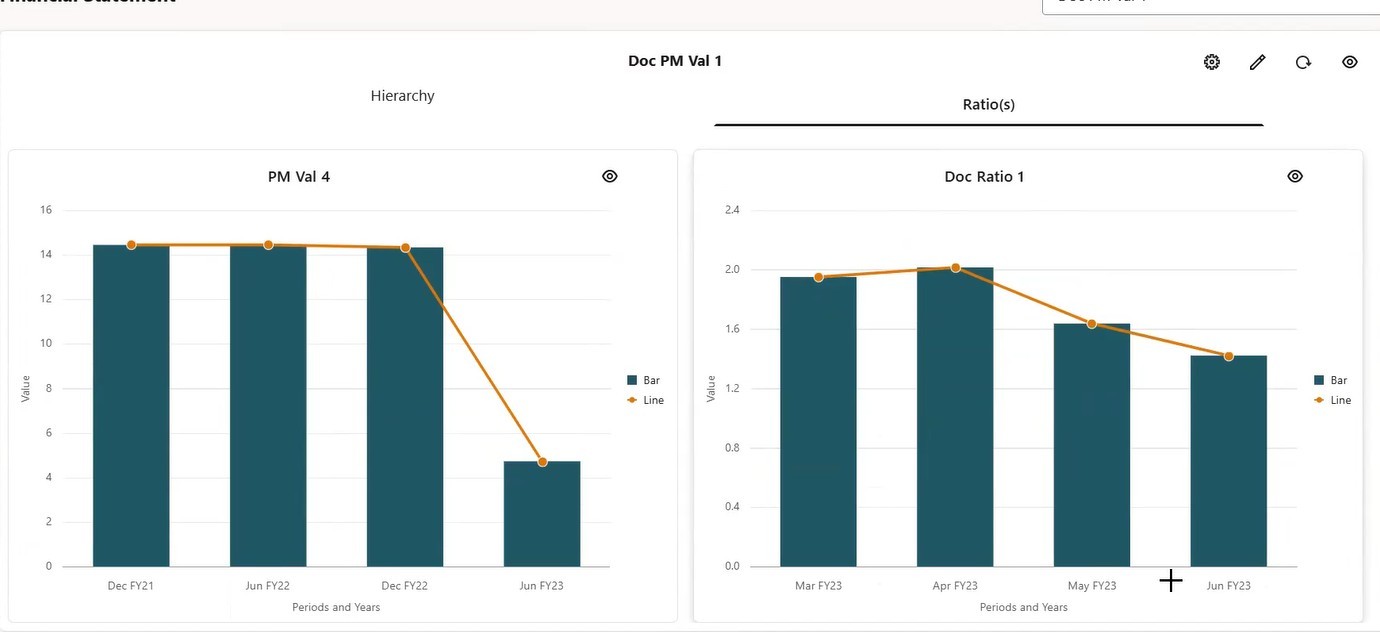
Figure 23-5 Detailed Analysis Example