Viewing Financial Analysis Key Highlights
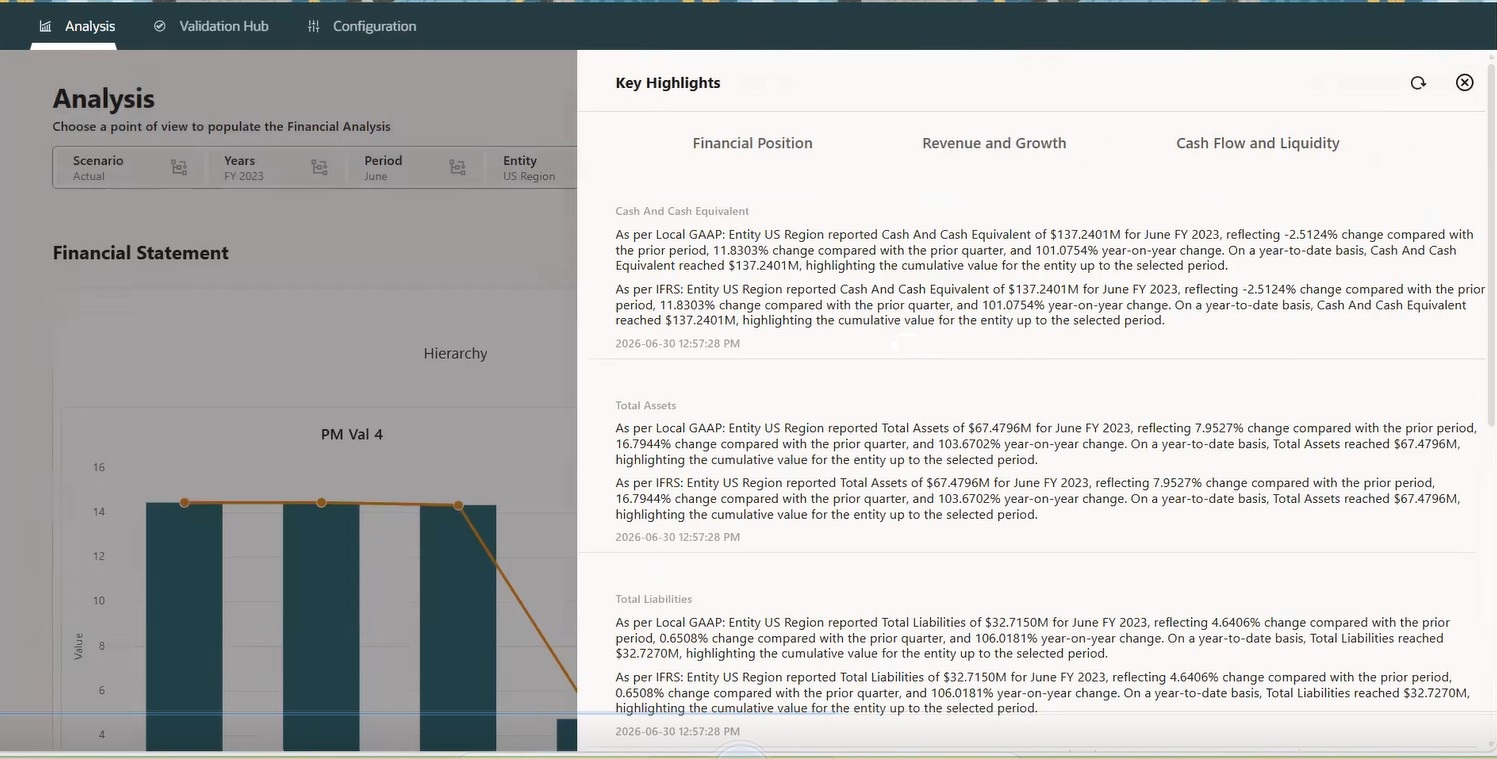
When you generate Financial Analysis results in the Financial Analysis Hub in Financial Consolidation and Close, a Key Highlights section is automatically configured as part of the dashboard to provide you with a quick analytical view of the selected main account balances and movements. This section displays key financial account details and current period values in comparison with the prior period, prior quarter, and prior year, enabling you to identify significant movements and trends directly from the dashboard.
The Key Highlights output is based on the main dashboard/configuration POV that you previously selected. The values in this section automatically inherit the selected POV from the dashboard, such as Entity, Scenario, Year, Period, Currency, Consolidation, View and other applicable dimensions configured for the dashboard.
-
On the Home page, click Financial Analysis Hub, then select Analysis.
-
From the list of configurations, select the Configuration for the analysis you want to view.
If there is no Configuration defined, the Key Highlights section uses all top level members.
-
From the top of the Analysis page, click Key Highlights.
-
The Financial Position tab is displayed by default.
The Key Highlights related to the Balance Sheet, Income Statement, and Cash Flow Statement are refreshed in the background and available to view. You can also click the Refresh button to view updated results.
-
Click the Revenue and Growth tab and Cash Flow and Liquidity tab to view additional highlights.
Figure 23-6 Financial Analysis Key Highlights Example